Event studies and news analytics are the universal toolkit for measuring the market impact of information. Whenever news reaches the market, a merger announcement, an earnings surprise, a rate decision, a product recall, or a corrective disclosure, the method isolates the abnormal return (the price move that cannot be explained by normal market behavior) and reports the sign, the size, and the statistical significance of the market's reaction. This hub maps the major applications into five groups, attaches a quantified and sourced stylized fact to each, and links every leaf to a dedicated guide and to the calculator that runs it.
One method, many questions
The logic is general. Define an event, estimate what returns (or volume, or volatility) should have looked like absent the event, then measure the deviation. The same machinery that establishes loss causation in a securities-fraud trial also sizes the synergy expectation priced into a takeover, scores the alpha in a post-earnings drift strategy, and reads the equity market's verdict on a central-bank surprise. The method has a four-step lineage: Dolley (1933) ran the pre-history, the first study of stock-split price effects; Fama, Fisher, Jensen and Roll (1969) built the first modern event study on 940 splits and gave the field its template (market-model residuals, event time, the cumulative abnormal return); MacKinlay (1997) codified the procedure; and Kothari and Warner (2007) wrote the modern econometric survey. The reliability of the standard daily-data procedure was established by Brown and Warner (1980, 1985).
One honesty note frames everything below. The founding short-window magnitudes are robust and have been replicated for decades. The long-horizon drift figures (post-earnings drift, repurchase underreaction) are sample- and model-dependent and partly contested, and the broader anomaly literature has documented systematic decay: McLean and Pontiff (2016) find published predictors deliver returns about 58% lower after publication, and Hou, Xue and Zhang (2020) find the majority of 452 documented anomalies fail to replicate once microcaps are controlled for and portfolios are value-weighted. That is not a footnote against the method: it is the load-bearing argument for why disciplined significance testing and a defensible expected-return model are central rather than optional. Where this page reports a number that has decayed or is contested, it says so.
New to the approach? Start with the concept of an event study, then the step-by-step application blueprint, and skim the worked example and pitfalls below before picking a group.
Foundational evidence at a glance
Five pillars, one magnitude each, define what the method can see:
- Origin. FFJR (1969): across 940 NYSE stock splits (1927 to 1959), cumulative abnormal returns rose for roughly 29 months before the split and then flattened to about zero, the first direct evidence of semi-strong market efficiency.
- Earnings information content. Ball and Brown (1968): about 85% to 90% of the information in annual earnings is already in price by the announcement month.
- Takeovers. Jensen and Ruback (1983): target shareholders earn about +20% in mergers and about +30% in tender offers; bidders earn about zero.
- Drift. Bernard and Thomas (1989): an extreme-decile earnings-surprise hedge earned roughly 18% annualized in the 60 days after the announcement (a figure that has since decayed, see below).
- Reliability. Brown and Warner (1985): with daily data and about 50 firms, the standard market-model test reliably detects abnormal returns of roughly 0.5% to 1% per day. Power comes from averaging across firms, which is exactly why single-firm litigation studies are the hard case.
Intuition: an event study is a natural experiment
The estimation window builds the counterfactual: the return the security would have earned absent the event, given how it normally moves with the market. The abnormal return is the treatment effect: the gap between what happened and that counterfactual. The significance test asks whether that gap is distinguishable from noise. Read every event study on three axes: sign (did the market judge the news good or bad), size (how much value changed hands), and speed (did prices anticipate or leak the news before the date, and did they overshoot and then drift back). Those three readouts recur in every application below.
Worked example: reading an abnormal return in one minute
The cleanest single illustration is the earnings example in MacKinlay (1997): 600 quarterly earnings announcements for the 30 Dow Jones Industrial firms, 1989 to 1993, sorted into good news, no news, and bad news.
- Estimate the normal return. Fit a market model (firm return regressed on the market return) over a clean pre-event window, for example 250 trading days ending well before the announcement. This gives the alpha and beta that define the counterfactual.
- Measure the day-0 abnormal return. On the announcement day the average abnormal return is +0.965% for good-news firms (test statistic about 9, overwhelmingly significant), -0.679% for bad-news firms (about -6), and a negligible +0.017% for no-news firms. The reaction is signed by the surprise and concentrated on the event day.
- Cumulate into a CAR. Sum the abnormal returns across the event window to get the cumulative abnormal return. Over the wider window the good-news CAR drifts further up and the bad-news CAR further down, with a little pre-event movement that hints at anticipation or leakage.
- Read sign, size, significance. Positive and significant means the market judged the news value-creating; the magnitude sizes the effect; the test statistic says it is not noise.
The mental image to keep is the original FFJR (1969) picture: the cumulative abnormal return climbs as the information arrives and then flattens once the news is public, because an efficient market has already impounded it. The same construct, run with the Abnormal Return Calculator, answers every question on this page.
Three numbers to anchor scale: a takeover target gains roughly +16% to +30% on the announcement (M&A); a good-news minus bad-news earnings day-0 spread is about plus or minus 1% (earnings); and the historical post-earnings drift over the following quarter was a few percent on extreme-surprise deciles (investment strategies), since decayed. Every other magnitude on this page is read on the same sign, size, and significance scale.
Who uses this in practice
Four practitioner segments rely on this toolkit daily:
- Sell-side M&A advisory. Event studies supplement comparable-transaction multiples in pitch books, informing bidding strategy with how the market actually received similar deals for both targets and acquirers (M&A advisory and pitch-book comparables).
- Quant and event-driven funds. Earnings drift, repurchase underreaction, and sentiment signals are systematized into tradable strategies; news-analytics vendors built whole businesses on this (investment strategies).
- Regulators and central banks. The SEC screens for abnormal moves to flag leakage and fraud, and antitrust agencies read rivals' announcement returns to test whether a merger is anticompetitive (competitive dynamics; reverse event study).
- Litigation economists. Damages experts at firms such as NERA, Cornerstone Research, Brattle, and Analysis Group file single-firm event studies to establish materiality and loss causation in securities-fraud cases (litigation).
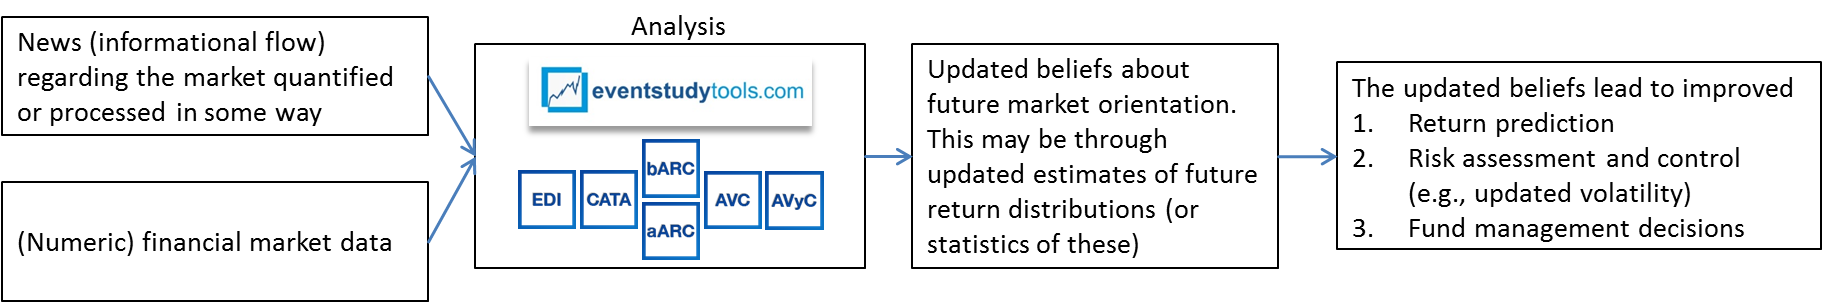
News analytics and event studies bridge the qualitative and quantitative sides of investment management, and our apps map onto that decision flow end to end. The flow runs in three stages: qualitative news and unstructured text are scored into structured, timestamped signals (news analytics), those signals are quantified as abnormal returns, volume, and volatility around the event (the calculators), and the quantified evidence feeds the investment, legal, or research decision.
Stylized facts at a glance
Every group below carries at least one numeric anchor. The table collects the headline magnitudes, their typical window, the source, and whether the effect has decayed. Short-window signs and magnitudes are robust; the long-horizon rows are the contested ones.
| Event type | Typical sign and magnitude | Window | Source | Decayed? |
|---|---|---|---|---|
| M&A target | about +16% (mergers about +20%, tender offers about +30%) | 3-day (-1,+1) | Andrade et al. (2001); Jensen-Ruback (1983) | No (stable) |
| M&A acquirer | about 0 on average (significantly negative for stock-financed bids, positive for cash); combined about +1.8% | 3-day | Andrade et al. (2001) | CAR-as-proxy refuted (2026) |
| Spin-off | about +3% (3.02% across 26 studies) | announcement | Veld and Veld-Merkoulova (2009) | No (stable) |
| Earnings (good vs bad) | about +1% / -0.7% day-0 | day 0 | MacKinlay (1997) | No (announcement effect) |
| Post-earnings drift (PEAD) | about 18% annualized historically (roughly 2% raw over about 60 days on extreme deciles), since shrunk to a small fraction | about 60 days post | Bernard-Thomas (1989); Martineau (2022) | Yes (and contested) |
| Open-market repurchase | about +12.1% (about +45.3% for value firms) | 4-year drift | Ikenberry et al. (1995) | Likely weakened out of sample |
| Product recall | about -0.8% to -1.9% | short window | Davidson and Worrell (1992) | No |
| Alliance / joint venture | about +0.6% on average (positive, value-creating) | short window | Chan et al. (1997) | No |
| Unexpected 25bp rate cut | about +1% on broad indices | announcement day | Bernanke-Kuttner (2005) | No (surprise-only; sign can flip, see below) |
Corporate events
The original home of the method: discrete, firm-level announcements with a clean date and a measurable price reaction. The market's response reveals how investors value the action, whether the news leaked early, and how much value changes hands. Methodologically, this group is the market-model-plus-BMP-test world: use the market model for the normal-return benchmark, the standardized cross-sectional (BMP) test of Boehmer, Musumeci and Poulsen (1991) for event-induced variance, and screen each event for confounding news, since in merger waves the events also cluster on common dates (Kolari and Pynnonen, 2010).
- Mergers and acquisitions: The canonical case. Targets earn large positive announcement returns, about +16% over a 3-day window (about +20% in mergers, about +30% in tender offers); acquirers are on average statistically indistinguishable from zero (about -0.7%, insignificant) and significantly negative for stock-financed bids while modestly positive for cash bids; the combined gain is about +1.8%, evidence of expected synergy that accrues overwhelmingly to targets (Andrade, Mitchell and Stafford, 2001, about 3,700 deals 1973 to 1998; Jensen and Ruback, 1983). A 2026 caveat sharpens the read: the announcement CAR measures the market's expectation, not realized value. Across about 47,000 deals it has essentially zero relation to outcomes such as goodwill impairment or operating performance, and acquirer CAR mostly revalues the acquirer rather than the deal (Ben-David et al., 2026). Use it for deal valuation, bidding strategy, and pitch-book comparables.
- Divestitures: Spin-offs, carve-outs, and asset sales let the market price the value of focus. Spin-off announcement CARs average about +3% (3.02% across 26 studies, higher for focus-increasing spin-offs) and, unusually, have not decayed: recent 2007 to 2017 samples find magnitudes of the same order as earlier work, and spin-offs reliably beat sell-offs and carve-outs (Veld and Veld-Merkoulova, 2009). A clean read on whether breaking up creates value.
- Earnings announcements: The reaction is signed by the surprise (about +1% day-0 for good news, about -0.7% for bad news; MacKinlay, 1997), and prices then drift in the same direction (post-earnings-announcement drift). PEAD was the textbook anomaly, with an extreme-decile hedge earning roughly 18% annualized in the 60 days after announcement (Bernard and Thomas, 1989), but it has measurably decayed (the drift has shrunk to a small fraction of its historical size, and is near zero in liquid large caps) and its survival in liquid US stocks is now genuinely contested, hinging on whether thinly traded microcaps are included (Martineau, 2022). Still the workhorse teaching example.
- Alliances and joint ventures: Partnerships, licensing deals, and JVs are softer signals than M&A, but the market still prices the expected payoff: a positive average announcement CAR of roughly +0.6%, an order of magnitude below target premia, with more value when partners pool technical knowledge (Chan, Kensinger, Keown and Martin, 1997). See how investors distinguish value-creating collaboration from press-release noise.
- Competitive dynamics (competitor analysis and strategy assessment): A firm's stock reacts not only to its own news but to rivals' moves. Measuring those cross-reactions identifies who the market sees as your real competitors and how exposed you are to their decisions, and turns the market's reaction to a firm's own competitive moves into a legitimacy benchmark for those decisions. The 2015 Volkswagen dieselgate episode is the vivid case: VW lost roughly EUR 27.4bn in abnormal equity value over the first five days, with about EUR 18.3bn of abnormal losses spilling over to rival automakers and a further about EUR 12.6bn to suppliers (Griffin, Lont and McClune, 2022). The shock concentrated on European competitors and suppliers connected to VW (Jacobs and Singhal, 2020). The same machinery underpins antitrust review (Eckbo, 1983, 1989): rivals rising on a merger announcement points to market power, rivals falling points to expected efficiency gains.
This group also carries the firm-internal applications often left implicit. Corporate compliance (leakage and insider-trading detection): reading the plot of abnormal returns for a pre-announcement run-up flags possible leakage or insider trading before a deal goes public. Operational and reputational risk: a data breach such as Equifax in 2017 (roughly -35% peak-to-trough over the following days, about $6bn of market cap, from about $143 to the low $90s on contemporaneous market data) or a recall (typically about -0.8% to -1.9% in a short window, more negative when the product is replaced than repaired; Davidson and Worrell, 1992) is sized the same way. For corporate events, returns are measured with the Abnormal Return Calculator (ARC), corroborating volume signals (a leakage tell) with the Abnormal Volume Calculator (AVC), and volatility reactions around earnings and recalls with the Abnormal Volatility Calculator (AVYC).
Investing and strategy
Documented market reactions are not just academic facts: they are tradable signals and inputs to allocation decisions. News analytics turns a stream of headlines into structured, timestamped event data that strategies can act on. The cautionary frame for the whole group is decay: published edges shrink about 58% after publication (McLean and Pontiff, 2016), so the methodological task is to distinguish a live edge from a decayed one. Long-horizon strategies need calendar-time portfolio designs to avoid the bad-model problem (see long-run event studies); short-window signals need event-induced-variance-robust tests.
- Investment strategies: Recast event-driven patterns as systematic signals, with the test statistics to tell a real edge from noise. Open-market repurchases are the classic underreaction case: a +12.1% four-year buy-and-hold abnormal return on average, and +45.3% for value firms, in the 1980 to 1990 sample (Ikenberry, Lakonishok and Vermaelen, 1995); like other published long-horizon edges, it should be expected to have weakened out of sample (McLean and Pontiff, 2016). The seminal news-analytics-as-signal result is Tetlock (2007): media pessimism predicts next-day downward pressure on the Dow with reversion within about a week.
- Tactical asset allocation signals: Aggregate event responses and sentiment shifts into timing signals for shifting weight across asset classes and sectors.
- Bottom fishing: Distinguish a genuine overreaction (a buying opportunity) from a justified repricing by quantifying the abnormal move and watching how it resolves. The repurchase-underreaction evidence above is the canonical "the market got it wrong, slowly" signal.
- Investment weather and investment clock: Read the macro regime from the market's reaction to economy-wide events and rotate positioning as the cycle turns.
This is the home of the commercial news-analytics ecosystem: platforms such as RavenPack, S&P Capital IQ / ClariFI, and AlphaFlash sell exactly this kind of signal, and news-analytics vendors built whole businesses on it (vendor materials report adoption across a large share of top-performing quant funds). Our News Analytics app (CATA) is the engine that produces this kind of signal: it turns headlines into the timestamped, sentiment-scored event data these strategies consume. Use the Event Date Identifier (EDI) to pin the exact event time and ARC to score the resulting return signals; this group is also where companies read corporate communications and investor-relations feedback, monitoring how the market receives their own stream of press releases.
Macro and cross-market
Scheduled and unscheduled macro events move whole markets in tight windows. The method generalizes from single firms to indices, sectors, bonds, currencies, and commodities, provided the series has a strong systematic benchmark. The governing rule is that only the surprise component moves prices, so the modern standard isolates it with high-frequency identification (30-minute windows around the release).
- Stock market responses to economy-wide events: Central-bank decisions, inflation and employment releases, and policy shocks move broad indices. An unanticipated 25bp rate cut is associated with about +1% on broad equity indices on the announcement day, and only the futures-implied surprise component moves prices (Bernanke and Kuttner, 2005). The relation is not a simple monotonic one: a "central-bank information effect" means a policy surprise can also move growth expectations and flip the naive sign of the equity reaction (Nakamura and Steinsson, 2018).
- Industry clockspeed monitoring: Track how fast and how sharply different industries react to shared shocks, a lens on which sectors lead, lag, or amplify the cycle. Price discovery is now fast: the initial reaction completes within minutes, and latency has fallen from seconds in the early 2000s to milliseconds today, which is what makes intraday event-date precision worth the effort.
Cross-market reactions cluster on common dates, which inflates naive significance tests, so these studies rely on variance-robust and clustering-robust significance tests (the Kolari-Pynnonen, 2010 adjustment, or calendar-time portfolios) and the appropriate expected-return models. Run the equity leg in ARC, pin the FOMC minute with EDI, and gauge attention and stress with AVC (volume) and the Abnormal Volatility Calculator (AVYC).
Academic and teaching
The event study is a staple of finance, accounting, economics, marketing, and law research, and a near-perfect teaching device: a single, intuitive procedure that produces a clean, testable result. The design choices referees expect are the estimation/event-window split, a defensible normal-return model, and rigorous confounding-event screening.
- Academic research: The standard tool for testing whether, and how fast, prices impound new information, and for measuring the value impact of corporate and policy events across thousands of studies. The modern survey is Kothari and Warner (2007).
- Research using event studies: A guide for non-finance researchers (in strategy, marketing, information systems, and management) who use stock-market reactions as an objective outcome measure, with the design choices and confounding-event controls that referees expect.
- Case study writing: Turn an abnormal-return plot into a narrative of how capital markets judged a company's decisions. The 1982 Tylenol poisonings are the canonical teaching case: Johnson & Johnson fell about 29% (roughly $2bn of market value) and recovered its prior high within about two months (Mitchell, 1989).
- Comparative event-type analyses: Place M&A, earnings, splits, and breaches side by side to teach how the sign, magnitude, and timing of the reaction depend on the type of event (see the table above for the side-by-side magnitudes).
Replication and coursework run end to end on ARC, AVC, AVYC, CATA, and EDI, with the methodology pages as the syllabus.
Legal and damages
The legal discussion below is grounded in US federal securities law (Rule 10b-5 fraud-on-the-market), where the case law and acceptance of the method are best documented; the methodology itself is jurisdiction-neutral and is also applied, with less codified case law, under the EU Market Abuse Regulation and in UK, German, and other securities-damages regimes. In US securities litigation the event study is not optional: courts effectively require one in fraud-on-the-market damages reports. It establishes materiality, supports loss causation by isolating the price drop on a corrective disclosure, and sizes per-share damages. The legal anchors are Basic v. Levinson (1988) (the fraud-on-the-market presumption), Dura Pharmaceuticals v. Broudo (2005) (which requires plaintiffs to prove loss causation, making a corrective-disclosure event study effectively mandatory), and Halliburton II (2014) (which let defendants rebut the reliance presumption with direct event-study evidence of no price impact at the class-certification stage). The SEC's acceptance of the method for materiality and damages traces to Mitchell and Netter (1994).
- Litigation: The legal scaffolding (materiality, reliance, loss causation, and damages) rests on single-firm event studies, and a single study can speak to all of them at the 95% confidence standard courts apply. These tests have inherently low statistical power: because a single firm cannot average away its own confounding news, detected price impacts are upward-biased against defendants and a non-significant result is weak proof of immateriality (Brav and Heaton, 2015). The number that makes this concrete: for the largest decile of firms, a price impact must move on the order of $900 million of market capitalization to be statistically detectable by a single-firm study at conventional levels (Gelbach, Helland and Klick, 2013). VW dieselgate (about EUR 27.4bn in abnormal loss over five days; Griffin et al., 2022) is the vivid materiality-and-damages illustration. The expert reports behind these cases come from firms such as NERA, Cornerstone Research, Brattle, and Analysis Group. (For a plain-language walkthrough of the method in a fraud case, see this short explainer video.)
Litigation-grade single-firm studies demand rigorous significance testing (including nonparametric robustness, given the low-power problem) and a transparent expected-return model; run them in ARC and use EDI to fix the disclosure date precisely, since a mis-timed date attenuates the measured abnormal return toward zero.
Related: financial-market regulation and anomaly detection
Two cross-cutting uses round out the toolkit. Regulators run the method in reverse: scan for unusual price moves first, then hunt for the news that explains them, a screen for potential fraud or leakage that can drop from annual to intraday (now millisecond) resolution to pin the moment of an abnormal move. And because the procedure simply detects anomalies in any series with a strong systematic correlate, it extends beyond equities to bonds, CDS, currencies, and commodities. That extension is feasibility-bounded: corporate-bond studies, for example, need daily TRACE data and value-weighted matched-portfolio benchmarks to have adequate power, because monthly bond methods are biased and underpowered (Bessembinder, Kahle, Maxwell and Xu, 2009); where a clean price benchmark is weak, the volume and volatility legs carry the signal. Both uses build on the same core methodology and the CATA news-analytics step that finds the news.
How to run this kind of event study
The general workflow is covered in the introduction to event study methodology and the step-by-step application blueprint. Before the design choices, a few preconditions decide whether the method applies at all:
- Semi-strong market efficiency is the maintained hypothesis. The method assumes prices impound public information quickly, so a clean post-event flattening is the expected pattern.
- The joint-hypothesis problem. Every test of an abnormal return is simultaneously a test of the expected-return model, so a result that looks abnormal can reflect a mis-specified benchmark rather than a real reaction.
- A publicly traded, liquid security with a clean return series. The procedure needs dividend-adjusted returns and a value-weighted market benchmark; it does not apply to private firms or illiquid assets without a price.
Given those preconditions, six design choices decide whether the result holds up:
- Event date. Verify it against news archives, and watch for leakage: significant pre-event abnormal returns are the diagnostic for a wrong, leaked, or after-hours date. A mis-timed date attenuates the measured effect toward zero. Use EDI.
- Estimation window. Commonly 120 to 250 trading days, ending before any run-up begins, and non-overlapping with the event window, or the normal-return model is contaminated by the event itself.
- Event window. Keep it short ((-1,+1) is the modern default); justify anything longer. Longer windows do not add signal, they add confounders.
- Expected-return model. The market model is the workhorse for short single-firm windows (model choice barely matters there); use Fama-French or Carhart factor models for size-, value-, or momentum-tilted cross-sections and any long-horizon design. For thinly traded or illiquid names, non-synchronous trading biases the estimated beta, so apply a Scholes-Williams or Dimson correction. See expected-return models.
- Significance tests. Use the BMP standardized cross-sectional test (Boehmer et al., 1991) for event-induced variance, the Kolari-Pynnonen (2010) adjustment or calendar-time portfolios for event-date clustering, and the Corrado (1989) rank test or a generalized-sign test as nonparametric robustness, especially for thin trading and small samples. See significance tests.
- Confounders. Screen each event window for other material news (earnings, guidance, dividends, regulatory action); in single-firm studies confounders do not average away. For long horizons, prefer calendar-time portfolio designs (see long-run event studies) to avoid the bad-model problem.
Run it with our tools
The applications on this site implement the workflow above end to end:
- Abnormal Return Calculator (ARC) is the core tool: supply an event file, choose estimation and event windows, pick an expected-return model, and run more than a dozen parametric and nonparametric significance tests built to handle clustered samples.
- Abnormal Volume Calculator (AVC) measures abnormal trading activity, a corroborating signal that information actually arrived and a tell for pre-announcement leakage.
- Abnormal Volatility Calculator (AVYC) measures volatility reactions, useful around earnings, recalls, and macro prints where the second moment carries the signal.
- News Analytics (CATA) turns headlines into timestamped, sentiment-scored event data and screens the surrounding news flow for confounders.
- Event Date Identifier (EDI) pins the precise event time, the single most important design decision in litigation, macro, and reverse-event-study work.
Common misconceptions and pitfalls
- Non-significance is not proof of no effect. Single-firm studies have low power, so a null result is weak evidence of immateriality, not proof of it (Brav and Heaton, 2015; see litigation).
- Longer windows do not add signal. Long-horizon buy-and-hold abnormal returns are fragile to the bad-model problem and skewness; use a short window and, for long horizons, calendar-time portfolios (Kothari and Warner, 2007; long-run event studies).
- Confounding news does not average away in single-firm studies. Screen the event window for other material announcements, or the measured CAR is not attributable to the studied event.
- The plain t-test over-rejects under event-induced variance. Use the BMP standardized cross-sectional test (Boehmer et al., 1991) and the Corrado (1989) rank test for robustness (see significance tests).
- An announcement CAR measures the market's expectation, not the realized outcome. It is forward-looking and conditioned on what was already anticipated, not a verdict on whether the deal or decision ultimately worked (Ben-David et al., 2026).
- An event study identifies the market's revaluation, not the firm's true economic value change. The abnormal return captures how investors repriced the security on the information, and it cannot by itself separate the information from the market's possibly-biased interpretation of it. Generalize the M&A caveat above: a measured CAR is the market's reaction, read on sign, size, and significance, not a direct measurement of underlying value created or destroyed.
- Published edges decay. An anomaly that worked in-sample may be arbitraged away post-publication (McLean and Pontiff, 2016); value-weighting and microcap controls decide whether it survives (Hou, Xue and Zhang, 2020).
Frequently asked questions
What is an event study?
An event study measures the market impact of a specific event by comparing the security's actual return to the "normal" return it would have earned absent the event, estimated from a pre-event window. The difference is the abnormal return. The method dates to FFJR (1969) and is codified in MacKinlay (1997).
What is an abnormal return and a CAR?
The abnormal return on a given day is the actual return minus the modeled normal return (typically from a market model). The cumulative abnormal return (CAR) sums those daily abnormal returns across the event window, giving the total value impact attributable to the event. Read it on three axes: sign, size, and significance.
How long should the event window be?
Short. The (-1,+1) three-day window is the modern default for clean announcement inference, because longer windows accumulate confounding news rather than signal. Long-horizon (multi-month or multi-year) studies are reliable only with calendar-time portfolio designs that handle the bad-model problem (Kothari and Warner, 2007).
How many events do I need?
For a multi-firm study, roughly 25 or more events gives acceptable test size and power, and power rises with sample size because abnormal returns average across firms (Brown and Warner, 1985). The single-firm litigation case is the hard one: with one event there is no cross-sectional averaging, so power is low and a defensible benchmark plus nonparametric robustness matters most.
Which significance test should I use?
For clean, large multi-firm samples a parametric t-test is fine, but use the BMP standardized cross-sectional test (Boehmer et al., 1991) when the event raises return variance, the Kolari-Pynnonen (2010) adjustment when events cluster on common dates, and the Corrado (1989) rank test for thin trading and small samples. See significance tests.
Can an event study detect insider trading or leakage?
Yes. Significant abnormal returns (and abnormal trading volume) before the official announcement date are the signature of information leakage or insider trading. Regulators exploit this directly by running the method in reverse: detect the abnormal move first, then look for the news that should have caused it (see reverse event study).
Can you trade on these reactions?
Sometimes, but with a decay caveat. Post-earnings drift and repurchase underreaction were tradable historically (about 18% annualized, roughly 2% raw over about 60 days on extreme deciles, and +12.1% over four years respectively), but both have weakened, and published edges fall about 58% after publication (McLean and Pontiff, 2016). Transaction costs, value-weighting, and microcap exclusion erode much of what looks like alpha in equal-weighted backtests (see investment strategies).
Does the method work outside equities?
Yes, for any series with a strong systematic benchmark: bonds, CDS, currencies, commodities, plus trading volume and volatility. Feasibility depends on data and benchmark quality; corporate-bond studies, for instance, need daily TRACE data and value-weighted matched portfolios to have adequate power (Bessembinder et al., 2009).
What is news analytics and how does it relate to an event study?
News analytics applies natural-language processing to machine-readable news and text, scoring each item for sentiment, relevance, and novelty, and turning an unstructured stream of headlines into structured, timestamped event data. That output is the input to a price-based event study: the news-analytics step finds and dates the event and characterizes the signal, and the event study then measures the abnormal return, volume, or volatility around it. The two are complementary, the qualitative-to-quantitative bridge in the figure above. Our News Analytics app (CATA) produces this kind of timestamped, sentiment-scored event data, and the seminal academic result that text predicts returns is Tetlock (2007).
Where to start
Pick the group that matches your question and follow the leaf link, or go straight to the apps: ARC for abnormal returns, AVC for abnormal volume, AVYC for abnormal volatility, CATA for news analytics, and EDI to identify event dates. New to the approach? Begin with the introduction to the methodology and the application blueprint, then browse the comparative event-type analyses for the magnitudes side by side. For the full source list, see the references.
References
- Andrade, G., M. Mitchell, and E. Stafford. 2001. "New evidence and perspectives on mergers." Journal of Economic Perspectives, 15(2): 103-120. https://doi.org/10.1257/jep.15.2.103
- Ball, R., and P. Brown. 1968. "An empirical evaluation of accounting income numbers." Journal of Accounting Research, 6(2): 159-178. https://doi.org/10.2307/2490232
- Basic Inc. v. Levinson, 485 U.S. 224 (1988). (Establishes the fraud-on-the-market presumption of reliance.) https://supreme.justia.com/cases/federal/us/485/224/
- Ben-David, I., U. Bhattacharya, S. Huang, and S. Jacobsen. 2026. "The (missing) relation between acquisition announcement returns and value creation." Journal of Finance, forthcoming. https://doi.org/10.1111/jofi.70038
- Bernanke, B. S., and K. N. Kuttner. 2005. "What explains the stock market's reaction to Federal Reserve policy?" Journal of Finance, 60(3): 1221-1257. https://doi.org/10.1111/j.1540-6261.2005.00760.x
- Bernard, V. L., and J. K. Thomas. 1989. "Post-earnings-announcement drift: Delayed price response or risk premium?" Journal of Accounting Research, 27(Supplement): 1-36. https://doi.org/10.2307/2491062
- Bessembinder, H., K. M. Kahle, W. F. Maxwell, and D. Xu. 2009. "Measuring abnormal bond performance." Review of Financial Studies, 22(10): 4219-4258. https://doi.org/10.1093/rfs/hhn105
- Boehmer, E., J. Musumeci, and A. B. Poulsen. 1991. "Event-study methodology under conditions of event-induced variance." Journal of Financial Economics, 30(2): 253-272. https://doi.org/10.1016/0304-405X(91)90032-F
- Brav, A., and J. B. Heaton. 2015. "Event studies in securities litigation: Low power, confounding effects, and bias." Washington University Law Review, 93(2): 583-614. https://openscholarship.wustl.edu/law_lawreview/vol93/iss2/15/
- Brown, S. J., and J. B. Warner. 1980. "Measuring security price performance." Journal of Financial Economics, 8(3): 205-258. https://doi.org/10.1016/0304-405X(80)90002-1
- Brown, S. J., and J. B. Warner. 1985. "Using daily stock returns: The case of event studies." Journal of Financial Economics, 14(1): 3-31. https://doi.org/10.1016/0304-405X(85)90042-X
- Chan, S. H., J. W. Kensinger, A. J. Keown, and J. D. Martin. 1997. "Do strategic alliances create value?" Journal of Financial Economics, 46(2): 199-221. https://doi.org/10.1016/S0304-405X(97)00029-9
- Corrado, C. J. 1989. "A nonparametric test for abnormal security-price performance in event studies." Journal of Financial Economics, 23(2): 385-395. https://doi.org/10.1016/0304-405X(89)90064-0
- Davidson, W. N., and D. L. Worrell. 1992. "The effect of product recall announcements on shareholder wealth." Strategic Management Journal, 13(6): 467-473. https://doi.org/10.1002/smj.4250130606
- Dolley, J. C. 1933. "Characteristics and procedure of common stock split-ups." Harvard Business Review, 11(3): 316-326.
- Dura Pharmaceuticals, Inc. v. Broudo, 544 U.S. 336 (2005). (Requires plaintiffs to prove loss causation.) https://supreme.justia.com/cases/federal/us/544/336/
- Eckbo, B. E. 1983. "Horizontal mergers, collusion, and stockholder wealth." Journal of Financial Economics, 11(1-4): 241-273. https://doi.org/10.1016/0304-405X(83)90013-2
- Eckbo, B. E. 1989. "The role of stock market studies in formulating antitrust policy toward horizontal mergers." Quarterly Journal of Business and Economics, 28(3): 22-38.
- Fama, E. F., L. Fisher, M. C. Jensen, and R. Roll. 1969. "The adjustment of stock prices to new information." International Economic Review, 10(1): 1-21. https://doi.org/10.2307/2525569
- Gelbach, J. B., E. Helland, and J. Klick. 2013. "Valid inference in single-firm, single-event studies." American Law and Economics Review, 15(2): 495-541. https://doi.org/10.1093/aler/aht009
- Griffin, P. A., D. H. Lont, and K. McClune. 2022. "Spillover effects from the Volkswagen emissions scandal: An analysis of stock and corporate bond markets." Schmalenbach Journal of Business Research, 74(1): 87-125. https://doi.org/10.1007/s41471-021-00121-9
- Halliburton Co. v. Erica P. John Fund, Inc. (Halliburton II), 573 U.S. 258 (2014). (Permits rebuttal of the reliance presumption with event-study evidence of no price impact.) https://supreme.justia.com/cases/federal/us/573/258/
- Hou, K., C. Xue, and L. Zhang. 2020. "Replicating anomalies." Review of Financial Studies, 33(5): 2019-2133. https://doi.org/10.1093/rfs/hhy131
- Ikenberry, D., J. Lakonishok, and T. Vermaelen. 1995. "Market underreaction to open market share repurchases." Journal of Financial Economics, 39(2-3): 181-208. https://doi.org/10.1016/0304-405X(95)00826-Z
- Jacobs, B. W., and V. R. Singhal. 2020. "Shareholder value effects of the Volkswagen emissions scandal on the automotive ecosystem." Production and Operations Management, 29(10): 2230-2251. https://doi.org/10.1111/poms.13228
- Jensen, M. C., and R. S. Ruback. 1983. "The market for corporate control: The scientific evidence." Journal of Financial Economics, 11(1-4): 5-50. https://doi.org/10.1016/0304-405X(83)90004-1
- Kolari, J. W., and S. Pynnonen. 2010. "Event study testing with cross-sectional correlation of abnormal returns." Review of Financial Studies, 23(11): 3996-4025. https://doi.org/10.1093/rfs/hhq072
- Kothari, S. P., and J. B. Warner. 2007. "Econometrics of event studies." In B. E. Eckbo (ed.), Handbook of Corporate Finance: Empirical Corporate Finance, Vol. 1, Ch. 1: 3-36. North-Holland. https://doi.org/10.1016/B978-0-444-53265-7.50015-9
- MacKinlay, A. C. 1997. "Event studies in economics and finance." Journal of Economic Literature, 35(1): 13-39. https://www.jstor.org/stable/2729691
- Martineau, C. 2022. "Rest in peace post-earnings announcement drift." Critical Finance Review, 11(3-4): 613-646. https://doi.org/10.1561/104.00000122
- McLean, R. D., and J. Pontiff. 2016. "Does academic research destroy stock return predictability?" Journal of Finance, 71(1): 5-32. https://doi.org/10.1111/jofi.12365
- Mitchell, M. L. 1989. "The impact of external parties on brand-name capital: The 1982 Tylenol poisonings and subsequent cases." Economic Inquiry, 27(4): 601-618. https://doi.org/10.1111/j.1465-7295.1989.tb00792.x
- Mitchell, M. L., and J. M. Netter. 1994. "The role of financial economics in securities fraud cases: Applications at the Securities and Exchange Commission." The Business Lawyer, 49(2): 545-590. https://www.jstor.org/stable/40687477
- Mitra, G., and L. Mitra (eds.). 2011. The Handbook of News Analytics in Finance. Wiley, p. 3. https://doi.org/10.1002/9781118467411
- Nakamura, E., and J. Steinsson. 2018. "High-frequency identification of monetary non-neutrality: The information effect." Quarterly Journal of Economics, 133(3): 1283-1330. https://doi.org/10.1093/qje/qjy004
- Tetlock, P. C. 2007. "Giving content to investor sentiment: The role of media in the stock market." Journal of Finance, 62(3): 1139-1168. https://doi.org/10.1111/j.1540-6261.2007.01232.x
- Veld, C., and Y. V. Veld-Merkoulova. 2009. "Value creation through spin-offs: A review of the empirical evidence." International Journal of Management Reviews, 11(4): 407-420. https://doi.org/10.1111/j.1468-2370.2008.00243.x
Evidence current as of 2026; figures carrying a decay note are time-sensitive. See the full bibliography for all sources cited across the site.