Industry clockspeed is the rate at which an industry renews its products, processes, and organizational structures. The term comes from Charles Fine's Clockspeed: Winning Industry Control in the Age of Temporary Advantage (Fine, 1998), which argues that every industry has its own evolutionary tempo: fast-clockspeed industries (semiconductors, software, consumer electronics) churn product generations in months, while slow-clockspeed industries (autos, chemicals, pharmaceuticals, aircraft) turn over in years or decades. The faster the clockspeed, the more temporary any competitive advantage, and the harder firms must work to re-architect their capabilities and supply chains. Fine calls the fastest sectors "industrial fruit flies" because they preview, in compressed time, the dynamics slower industries will eventually face.
The seminal source, in full. Fine's book carries two load-bearing ideas beyond the "industrial fruit fly" line, and both supply the strategic rationale for continuous monitoring rather than a one-time measurement. The first is the double helix: industries oscillate over time between vertical integration around a single dominant firm and horizontal, modular disintegration around many specialists, the way the PC industry moved from IBM's integrated machine to the Intel-Microsoft-Dell modular stack. Structure is therefore itself a dynamic, observable variable, not a fixed backdrop. The second is the subtitle's temporary advantage: the faster the clockspeed, the more perishable any competitive advantage becomes, so in fast-clockspeed sectors a firm that measures its position once and stops is already behind. That is precisely why the clock must be read as a live series. The double helix also extends the monitor beyond products: oscillation between integration and disintegration is itself a measurable structural clock, readable from the counts of mergers, spin-offs, and partnerships (the organizational dimension of Mendelson and Pillai, 1999) that CATA can classify alongside product news.
This page treats clockspeed as something an investor or strategist can measure and monitor, not just describe. The bridge is the event study: a high-clockspeed industry generates a dense, frequent flow of value-relevant news (new-product introductions, R&D milestones, partnerships, launches), and each of those events leaves a measurable signature in abnormal returns and abnormal trading volume. Counting the events gauges the pace of change; quantifying their market impact gauges how much that change matters. News analytics (our CATA application) detects and dates the events; the Abnormal Return and Abnormal Volume calculators (ARC and AVC) measure their price and volume impact. Together they turn a qualitative strategy construct into a monitored, longitudinal series. We make the honest framing explicit below: equating a rolling count of news-event abnormal returns with Fine's construct is our own defensible synthesis, supported by the literatures on clockspeed measurement, new-product event studies, and news analytics, rather than a single citable result.
The clock metaphor, made concrete. A clockspeed monitor treats each genuinely novel value-relevant news event as one tick of the industry's clock: how often the ticks arrive measures how fast the clock runs (frequency), and the abnormal return or abnormal volume on each event measures how loud each tick is (impact). The most famous measurable clockspeed is Moore's Law, where transistor density doubles roughly every two years, an instantly recognizable quantitative tempo. Even that canonical clock is time-varying: Intel's Pat Gelsinger acknowledged in 2023 that doubling has slowed to roughly every three years, so the most famous clock in technology is itself a live illustration of this page's thesis that clockspeed is a measurable, changing quantity rather than a constant. Fine's "industrial fruit fly" line captures the strategic payoff: the fastest sectors preview, in compressed time, what slower sectors will face, so reading their clock is also a forecast.
Count times impact mnemonic: Clockspeed signal = (event frequency, normalized per active firm) × (average abnormal return or volume per event). Frequency without impact is just coverage growth; impact without frequency is an isolated shock. A monitor needs both.
The count-versus-impact quadrant. Because the signal is a product of two factors, every industry-quarter falls into one of four cells, and each calls for a different read:
| Low per-event impact (small CAR/volume) | High per-event impact (large CAR/volume) | |
|---|---|---|
| High event frequency | Fast but routine: dense incremental launches (mature consumer electronics). Genuine high clockspeed, but each tick is cheap; watch the trend, not the headlines. | Hot zone: frequent and consequential (AI software in a boom). The strongest true-acceleration signal; price every spike with the full battery. |
| Low event frequency | Sleepy: few events, little reaction (slow-clockspeed utilities). The clock is genuinely slow. | Low frequency, high stakes: rare but huge ticks (biotech readouts, regulatory decisions). Key ARC to an EDI-identified disclosure date; one event can double or halve a stock. |
Reading only the count collapses the columns (you mistake "fast but routine" for "hot zone"); reading only the impact collapses the rows (you mistake "low frequency, high stakes" for the whole industry's tempo). The monitor needs the cell, not the margin.
What the research shows
Three distinct literatures underwrite this use case: the strategy and operations work that defines and measures clockspeed, the event-study work that prices new-product news, and the news-analytics work that links news flow, tone, and volume to returns and volatility.
Clockspeed is multi-dimensional and measurable
Mendelson and Pillai (1999) provide the first rigorous operationalization, decomposing clockspeed into three dimensions: product clockspeed (how fast product generations turn over), process clockspeed, and organizational clockspeed (operationalized as a dichotomous "major restructuring in the prior three years"). Using electronics-industry data they build an integrated index and show that faster-clockspeed sub-sectors run shorter development cycles, redesign products more frequently, ramp production faster, and reorganize more often. The three dimensions need not move together, so any single news-frequency proxy (such as a new-product-introduction count) measures product clockspeed specifically, not the full construct. Dedehayir and Makinen (2011) extend this into the modern, systemic context, measuring clockspeed as the rate of performance improvement of a focal technology within its ecosystem and showing that component-level and system-level clockspeeds can diverge: a further reason a single product-news proxy is a partial measure. Nadkarni and Narayanan (2007), across 225 firms in 14 industries, establish that clockspeed is a performance-relevant variable: complex, flexible strategic schemas pay off in fast-clockspeed industries, while focus and persistence pay in slow ones. Because the right strategy depends on the clockspeed, measuring it has direct managerial value, which is the motivation for monitoring it. Carrillo (2005) and Souza, Bayus and Wagner (2004) close the loop on the practitioner argument: the optimal pace of a firm's own new-product introductions rises with industry clockspeed, formalizing the intuition that firms must synchronize their launch cadence with rivals or fall behind.
New-product news earns abnormal returns, largest in fast-clockspeed sectors
The single most citable fact connecting clockspeed to abnormal-return monitoring is that new-product announcements are priced. Chaney, Devinney and Winer (1991), the seminal event study of new-product announcements (1975 to 1984, 23 industries), find a mean three-day abnormal return of about +0.75% for genuinely new products and about +0.4% for product updates, alongside an average market-value gain of roughly $26 million per new-product announcement. The two figures are distinct cuts of the same study rather than algebraic restatements of each other: the average sample firm was worth about $532.57 million, so the dollar gain is not simply the percentage applied to that mean (which would imply only about $4 million); the larger dollar figure reflects the heavier weight of large-capitalization announcers. Both are genuine Chaney et al. results and both are worth citing, but they should not be presented as an arithmetic identity. Crucially, the effect is largest in technology-dependent, R&D-intensive industries (computers, chemicals, pharmaceuticals, electrical), which are precisely Fine's fast-clockspeed sectors. The cross-sectional magnitude of the abnormal return therefore itself tracks clockspeed. The return is not unconditional: Sorescu, Shankar and Kushwaha (2007) show that preannouncements earn positive short-run returns only when they carry specific product information, and positive long-run returns only when firms keep updating the market, with credibility amplifying the effect. The seminal academic study of this failure mode is Bayus, Jain and Rao (2001), "Truth or Consequences," whose software-industry evidence and two-firm game-theoretic model show that some firms strategically preannounce products they cannot yet ship in order to deter rivals. Vague or unfulfilled "vaporware" preannouncements, common in fast-clockspeed software and hardware, destroy value, which means the novelty and specificity filter is part of identifying the signal, not just cosmetic denoising. Broader new-product and innovation-disclosure event studies report CARs of roughly +0.3% over three days and +0.5% over longer windows, larger when innovation disclosure is more extensive and when the product is realized rather than merely planned. Not every category of new-product news is priced, however. Recent disclosure studies report that AI-related product news is not unconditionally rewarded: one sample of several hundred AI-embedded new-product announcements by large-cap firms over 2009 to 2018 showed no significant average abnormal return on its own, and related work finds that an apparent AI-mention premium of roughly +0.76 percentage points loses significance once the broader AI-hype regime is controlled for. The lesson is that event-type and novelty classification (which CATA provides) determines whether a clock tick is value-relevant, rather than the mere presence of a buzzword.
Recent and meta evidence: the count-then-price pipeline is now frontier practice
The pre-2010 anchors above have been confirmed and extended with modern text-classification methods that are essentially what this page proposes. Mukherjee, Pellegrino, Zaldokas and co-authors (2024) build a text-based new-product measure from Capital IQ Key Developments and Dow Jones Factiva, refined with a convolutional neural network trained on human-labeled articles, over 2002 to 2021. In a Fama-French three-factor event study they find an announcement-day abnormal return of about 29 basis points, peaking near 30 basis points at t+1 and still about 13 basis points at t+9 with no reversal (events within three days of earnings, M&A, or dividend news are excluded). New-product creation is disproportionately concentrated in high-market-power firms: feeding the abnormal-return-implied private values through a GHL oligopoly demand system, the authors estimate aggregate welfare gains averaging roughly 0.15% to 0.20% of US GDP per year, of which producer surplus is about 60% and consumer surplus about 40%, with own-firm profits of about $18 billion to $20 billion per year partially offset by negative substitution spillovers of about $5 billion to $7 billion per year to competitors. (These welfare and spillover magnitudes are from the NBER conference draft, which is marked preliminary; we cite the draft's stated aggregates and flag that they may move in the published version.) This is a direct, large-sample validation that the count-then-price clockspeed pipeline, with text classification at the front and event-study pricing at the back, is exactly what frontier researchers now do, and the magnitude (~30 basis points two-day) sits comfortably inside the +0.3% to +0.75% range of the classic studies. It also updates a stylized fact: the heaviest clock ticks come from market-power leaders, not the average firm. On the measurement side, Dedehayir and Makinen (2011) are the principal post-2000 reference for treating clockspeed as a measurable, longitudinal quantity in a systemic context, and Sood and Tellis (2009) show why aggregating the event stream matters: across 5,481 announcements they estimate the total stock-market return to a full innovation project at about $643 million, more than thirteen times the roughly $49 million value of a single average innovation event. A clockspeed monitor that sums the stream therefore captures far more than any isolated event CAR.
News flow, tone, and volume move returns and volatility
The machinery that turns news into a measurable signal comes from the news-analytics literature. Tetlock (2007) shows that high media pessimism predicts short-horizon price declines that revert to fundamentals, and that both abnormally high and abnormally low pessimism predict elevated trading volume, validating tone and volume as drivers of returns. Loughran and McDonald (2011) demonstrate that general-purpose word lists misclassify roughly three-quarters of "negative" words in financial text and introduce finance-specific sentiment dictionaries that link to returns, volume, and volatility. Their lesson, that a general lexicon is wrong for finance, still stands; what has changed is the ceiling. The current frontier for the sentiment layer is contextual transformer and large-language-model scoring: Huang, Wang and Yang (2023) report that FinBERT classifies financial sentiment at about 88.2% out-of-sample accuracy versus about 62.1% for the Loughran-McDonald dictionary, excelling precisely on sentences dictionaries mislabel as neutral. The Loughran-McDonald list remains valuable as a transparent, replicable baseline, but a modern clockspeed monitor should prefer finance-domain transformer or LLM scoring for the sentiment dimension. Boudoukh, Feldman, Kogan and Richardson (2019) find that identifiable firm-specific news accounts for about 49.6% of overnight idiosyncratic volatility (versus about 12.4% during trading hours), and that on extreme-move days, identified-news days show return continuation (drift) while no-news days reverse. Chan (2003) reaches the same conclusion from headlines: prices drift after real news but reverse after large no-news moves. Separating news days from no-news days is therefore empirically essential. Da, Engelberg and Gao (2011) add an attention channel: search-based attention spikes around events predict roughly two weeks of price gains followed by reversal within a year, so attention and news intensity are leading, mean-reverting signals rather than permanent repricing. At the macro level, Bybee, Kelly, Manela and Xiu (2024) show that a topic model over business-news text recovers themes whose attention shares track real economic activity and forecast aggregate returns: strong, recent, top-journal evidence that news-attention flow is a legitimate measure of economic dynamism, which is the intellectual foundation for reading clockspeed off news analytics. The methodological backbone for the text processing itself is Das (2014), the canonical news-analytics framework (sentiment, relevance, novelty via NLP).
Rival spillovers: competitive versus contagion effects
Industry dynamism is about more than a single firm's launches; it is about how one firm's news re-prices its rivals, which is exactly what cross-sectional event studies measure. A focal firm's product or innovation success can lower rivals' returns (a technological-race or competitive effect) or raise them (positive contagion). Lang and Stulz (1992), studying intra-industry transmission, document that bad news at one firm produces an average rival reaction of about -0.56% over three days, with the sign and size depending on industry structure: the competitive effect tends to dominate in concentrated industries, contagion in industries with high product-market fluidity. Sorescu and Spanjol (2008), studying more than 20,000 consumer-packaged-goods launches, show the magnitude of the underlying innovation and sharpen the breakthrough-versus-incremental distinction this page leans on. A genuinely breakthrough innovation raises normal profits, economic rents, and firm risk all at once, with the higher risk offset by above-normal stock returns, and is associated with roughly $4.2 million in additional long-run firm value per innovation; an incremental innovation raises normal profits only, with no effect on rents or risk. So novelty does not merely scale the reaction, it changes its character, which is exactly why a clockspeed monitor must classify ticks rather than count them flat, and why the cross-sectional re-pricing breakthroughs trigger in rivals is economically meaningful. In pharmaceuticals, for example, a rival's clinical-trial or regulatory success often lowers a firm's returns, a clean illustration of the competitive effect within an industry's clockspeed. Modern large-sample evidence agrees: Mukherjee et al. (2024) estimate $5 billion to $7 billion per year in negative substitution spillovers to competitors. Monitoring these spillovers across an industry panel, rather than a single focal firm, is the empirical core of "industry dynamism and disruption," and is treated in depth on our Competitive Dynamics page.
Stylized facts to anchor expectations
For a practitioner, the quantitative anchors are: new-product announcements earn small positive average abnormal returns (roughly +0.75% over three days for new products, +0.4% for updates), strongest in technology-dependent and R&D-intensive industries; abnormal trading volume is an independent and often cleaner marker of an information event than returns alone, because volume reacts to information arrival regardless of sign; identified fundamental news drifts while pure attention or sentiment spikes mean-revert; and clockspeed itself co-moves with shorter development cycles, shorter product life cycles, and more frequent reorganizations. As a counterpoint, slower-clockspeed industries such as automobiles show new-model introductions on a predictable annual rhythm with smaller per-event abnormal returns: Pauwels, Silva-Risso, Srinivasan and Hanssens (2004), the canonical multivariate time-series study of the automobile sector (Fine's archetypal slow-clockspeed industry), find that new-product introductions raise long-term firm value while sales promotions raise top-line sales but not durable firm value, so it is the NPI stream, not the promotional noise, that carries the genuine clock-tick signal. Meanwhile a regulated industry such as pharmaceuticals can pair a low headline news-frequency with a high per-event impact. A clockspeed monitor therefore needs both the count (frequency) and the impact (abnormal return and volume), because neither alone is sufficient.
Magnitudes are not stable constants. One honest caveat tempers the drift-after-real-news claim: the magnitudes above are sample-period dependent and have been eroded by arbitrage. Chordia, Subrahmanyam and Tong (2014) find that post-earnings-announcement drift and related news-driven anomalies have attenuated toward insignificance in the high-liquidity, high-trading-activity US market: post-earnings-announcement drift runs only about 0.14% per month in the most liquid stocks versus about 1.60% per month in the least liquid, so the tradable drift survives mainly in less-arbitraged corners (and some of it reflects the persistence of standardized unexpected earnings rather than pure mispricing). The decay is fast at the frontier: Lopez-Lira and Tang (2023) report that an LLM-news long-short strategy's annualized Sharpe ratio fell monotonically from about 6.54 in late 2021 to about 3.68, then about 2.33, then about 1.22 by early 2024 as AI news-processing diffused. A clockspeed monitor should therefore read the drift component of any news signal as a time-varying, decaying quantity, not a fixed coefficient, and weight the contemporaneous reaction and abnormal volume (which do not depend on a tradable drift surviving) more heavily for the longitudinal series.
| Event type | Window | Mean CAR or magnitude | Source |
|---|---|---|---|
| Genuinely new products | 3-day | about +0.75% (about $26M value gain) | Chaney et al. (1991) |
| Product updates | 3-day | about +0.4% | Chaney et al. (1991) |
| Generic new-product / innovation disclosure | 3-day | about +0.3% | Broader NPI literature |
| Text-classified new products (2002 to 2021) | 2-day (FF3) | about +29 to 30 bps, no reversal through t+9 | Mukherjee et al. (2024) |
| Clinical trial, Phase 2/3 positive | day 0 / (0,+1) | about +1.63% / +1.95% | Lo et al. (2022) |
| Clinical trial, negative outcome (asymmetric) | (0,+1) | about -1.7% median (downside larger, more persistent) | Lo et al. (2022) |
| Single innovation event vs full project | value | about $49M vs about $643M (over 13x) | Sood and Tellis (2009) |
| Rival reaction to intra-industry bad news | 3-day | about -0.56% | Lang and Stulz (1992) |
| Identified news as share of idiosyncratic volatility | overnight vs intraday | about 49.6% vs about 12.4% | Boudoukh et al. (2019) |
Our news-analytics evidence: new-product-introduction rates by industry
Using our news-analytics capability we have analyzed new-product-introduction rates across industries and plotted their quarterly evolution. Over recent years, firms have digitized internal processes and opened up their innovation functions; both developments raise innovation rates, so the industry increasingly acts as a Taktgeber (pace-setter): firms must synchronize their behavior more strongly with rivals or risk falling behind, exactly the optimal-pacing logic of Souza, Bayus and Wagner (2004). Figure 6 shows the new-product-introduction series for four industries identified by SIC code. The contrast is the point: it pairs slower-clockspeed Insurance Carriers (SIC 63) and Printing and Publishing (SIC 27) against the faster, more volatile cadence of Chemicals (SIC 28) and Business Services (SIC 73). These counts are a product-clockspeed proxy derived from classifying press-release news, not the full Mendelson and Pillai construct; for current cross-market comparability the legacy SIC codes can be mapped to NAICS or GICS, and raw counts should be normalized by the number of active firms or by total news volume so that rising press-release volume is not mistaken for accelerating clockspeed.
Figure 6: IndustryClockSpeeds (New Product Introductions) by Industries [SIC]
(Insurance Carriers [63], Chemicals and Allied Products [28], Business Services [73], Printing, Publishing, and Allied Industries [27])
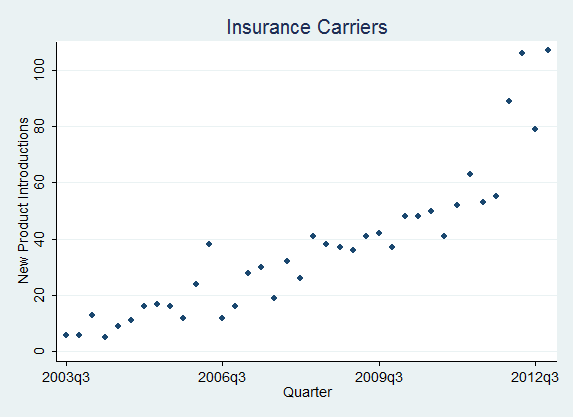
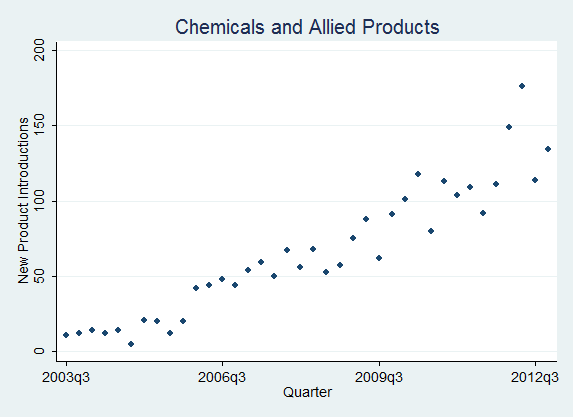
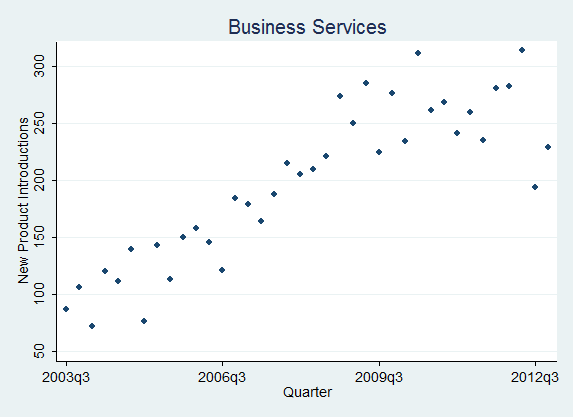
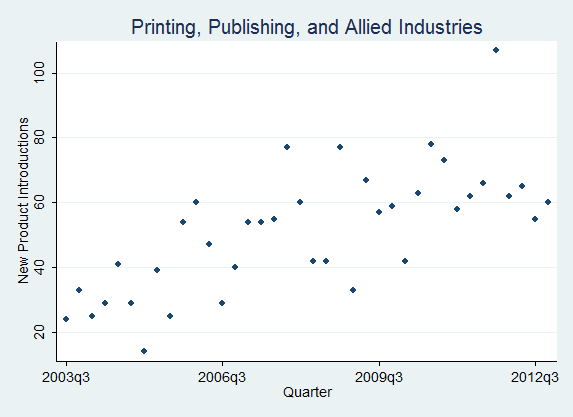
How to read Figure 6. Three reading rules keep these series honest. The slope is the acceleration: a series bending upward is the clock speeding up, a flat or declining one is steady or slowing. The spikes are launch waves, often clustered (rivals shipping together), which is exactly the event-date clustering the significance tests below must correct for. And always normalize before reading: a raw count rising because the industry has more firms, or because press-release volume grew, is coverage inflation, not acceleration; divide by active firms (or total news volume) and novelty-filter first. The four panels are deliberately paired to make the contrast visible, slower Insurance Carriers (SIC 63) and Printing and Publishing (SIC 27) against faster, spikier Chemicals (SIC 28) and Business Services (SIC 73).
Clockspeed is accelerating, and now you can measure it
Fine's 1998 taxonomy was static; the more interesting fact today is that clockspeed appears to be a rising trend even in industries he classified as slow, and the news-analytics pipeline is built to track that motion. In pharmaceuticals, the lag before a rival product enters the same therapeutic class has compressed sharply: DiMasi (2016) finds the median time from first-in-class approval to first competitor fell about 51%, from 4.7 years for drugs approved in 1998 to 2004 to 2.3 years for those approved in 2005 to 2011, with the Inflation Reduction Act compressing the commercial lifecycle further: a "slow" industry visibly speeding up. In automobiles, the canonical slow-clockspeed sector in Fine's book, over-the-air updates and software-defined vehicles now let manufacturers ship features after start of production. The concrete mechanism is software: Tesla pushed on the order of 124 distinct over-the-air updates to the Model 3 within roughly 18 months, and the architectural shift behind it is electronic-control-unit consolidation, from up to about 150 ECUs in a legacy car toward a handful of high-performance compute domains (Rivian's second-generation R1 reportedly runs about 7). That collapses product cycles through continuous integration, continuous delivery, and digital twins, turning a sector that used to tick once a model year into one that ticks continuously. Both are measurable as a rising count-times-impact series rather than asserted from a fixed taxonomy.
Is clockspeed actually accelerating? Let the monitor settle it. The acceleration thesis is genuinely contested. The shrinking-product-life-cycle claim has been challenged since at least Bayus (1994), who found little support for an economy-wide collapse in life cycles, and the more honest reading of the modern evidence is that acceleration is segment-specific: rapid in smart-home, wearables, and AI-embedded software, far slower elsewhere. This is a feature, not a bug, for the use case. A clockspeed monitor is precisely the instrument that settles the question empirically per segment instead of asserting it: a normalized, novelty-filtered, impact-weighted series either bends upward for a given SIC or NAICS code or it does not. The macro backdrop, however, is suggestive. Innosight's 2021 Corporate Longevity Forecast reports that the average tenure of an S&P 500 company fell from about 33 years in 1964 to about 24 years by 2016 and is projected to reach about 12 years by 2027, implying that roughly half the index turns over each decade: economy-wide churn consistent with a rising clock, which the per-segment monitor then localizes.
The pharmaceutical counterpoint above also quantifies the "low frequency, high impact" pattern: across 13,807 trial outcomes for 379 US-listed firms (2000 to 2020), Lo et al. (2022) find Phase 2/3 positive readouts move the stock about +1.63% on day 0 and about +1.95% over (0,+1), early-positive outcomes about +2.21% to +2.40%, and negative outcomes a median of about -1.7% over (0,+1) with the downside larger and more persistent than the upside, significant only on day 0 and (0,+1). That is precisely an ARC job keyed to an EDI-identified first-disclosure date.
How to run this kind of event study
The general workflow (estimation window, expected-return model, event window, abnormal returns, significance testing) is covered in our Introduction to Event Study Methodology and the step-by-step Event Study Application Blueprint. A clockspeed monitor combines two modes: a longitudinal aggregation that builds the clockspeed series, and conventional event studies that quantify the impact of the individual events underneath it.
Build the clockspeed series first
Clockspeed monitoring is fundamentally a time-series exercise. The pipeline is: (1) ingest a corporate-news or press-release corpus; (2) use news analytics to classify and extract event types (new-product, R&D, partnership, M&A) and to score sentiment, relevance, and novelty; (3) aggregate event counts per industry (SIC, NAICS, or GICS) per quarter into a clockspeed series; (4) for any flagged event, hand the individual firm-event observations to the abnormal-return and abnormal-volume tools. Two normalization steps protect the inference: divide counts by the number of active firms (or by total industry news volume) so that media-coverage growth is not read as accelerating clockspeed, and filter for novelty so that syndicated or boilerplate reprints do not inflate the count. Only genuinely novel news should register as a "clock tick." The operational clockspeed proxy is the joint series of event count and average per-event impact, because frequency without impact is noise and impact without frequency is an isolated shock.
Event-date identification: use the first public disclosure
For product and news events the value-relevant date is usually the first public disclosure (a preannouncement, press release, trade-show reveal, or first newswire mention), not the ship date. News analytics helps by timestamping the earliest media mention; use that news date and inspect the pre-event window for information leakage. The dating decision is also an identification decision: Sorescu, Shankar and Kushwaha (2007) show that only the first informative preannouncement (one carrying specific product information) earns a positive reaction, while the vague vaporware preannouncements studied by Bayus, Jain and Rao (2001) are negative-signal events, so dating on the first substantive disclosure (with the novelty and specificity filter) determines whether the CAR is even the right sign. Our Event Date Identifier (EDI) is built for exactly this reconciliation problem.
Dating uncertainty is a power problem, not just a data problem. News dates are fuzzy in a way that ship dates and filing dates are not, so the monitor should treat the event date as estimated rather than exact. Ball and Torous (1988) formalize this with a maximum-likelihood estimator that allows a random event date, jointly estimating the per-day abnormal return, its variance, and the probability that the event fell on each day in a short window; when the date is genuinely uncertain this is more powerful than forcing a single point date, and it is robust across a roughly two-day event period, which is the right default for product news whose exact disclosure moment is ambiguous. A distinct and common dating error is timing: many press releases and newswire items cross after the market close. Berkman and Truong (2009) show that after-hours announcements are reflected in the next trading session, so dating them on the calendar date of the release biases returns and volume; the fix is to shift day 0 to the next session or, when the intraday timestamp is unknown, to include day +1 in the event window. A raw-timestamp monitor that skips this will mis-date a large share of its ticks by one day.
A reproducible clock-tick rule. "Novelty filtering" needs a concrete threshold to be replicable. The commercial twins of CATA's novelty and relevance scores make the rule explicit: RavenPack's Relevance score (0 to 100, classifier-based entity prominence) and its Event Novelty Score (ENS, 0 to 100, where the first story of a categorized event in a 24-hour window scores 100 and later echoes score lower) together define a clean detector. A defensible default counts a clock tick only when Relevance is high (for example 75 to 90 or above, so the firm is the story's subject rather than a passing mention) and ENS equals 100 (so the tick is the first disclosure, not a syndicated reprint). CATA's relevance and novelty outputs implement the same logic on a free, transparent stack.
Window choice and benchmark model
A tight three-day window such as (-1,+1) or (0,+1) captures most of the immediate reaction and limits confounding, following Chaney, Devinney and Winer (1991); a three-day window captures the large majority of the immediate price adjustment in liquid markets. Widen to (-2,+2) or (-5,+5) only to capture leakage or drift, accepting more contamination. For continuation tests, use a post-event window (for example (+2,+20)) consistent with Boudoukh et al. (2019). The market model, estimated over roughly 120 to 250 trading days ending well before the event, is standard and performs well at daily frequency (Brown and Warner, 1985); market-adjusted or Fama-French alternatives give similar results over short windows (MacKinlay, 1997). See Expected Return Models for the choices our tools implement.
Worked example: a new-product CAR, step by step. Firm X announces a genuinely new product. The market model is fit over an estimation window of 200 trading days ending 30 days before the event, giving alpha = 0.0001 and beta = 1.2. We use a (-1,+1) event window. For each day, the expected return is E[R] = alpha + beta × Rm, and the abnormal return is AR = Rfirm - E[R].
| Day | Rm | Rfirm | E[R] = alpha + beta·Rm | AR = Rfirm - E[R] |
|---|---|---|---|---|
| -1 | +0.40% | +1.50% | 0.01% + 1.2×0.40% = 0.49% | +1.01% |
| 0 | +0.20% | +0.90% | 0.01% + 1.2×0.20% = 0.25% | +0.65% |
| +1 | +0.30% | +0.60% | 0.01% + 1.2×0.30% = 0.37% | +0.23% |
CAR(-1,+1) = 1.01% + 0.65% + 0.23% = +1.89% for this single firm. Averaged across a sample of such announcements, idiosyncratic noise cancels and the mean CAR settles toward the Chaney benchmark of about +0.75% for genuinely new products. The point of aggregation is exactly this: a single firm's CAR is dominated by noise, but the cross-sectional mean recovers the priced clock-tick signal.
Worked example: reading the clock as a series, not a single event. The CAR box above prices one announcement; the clockspeed thesis is about a stream, and the most common error is to read raw counts straight off. Take an industry of 50 active firms over two quarters. The raw novel-event counts are 80 in Q1 and 95 in Q2, an increase that looks like ordinary coverage growth and is easy to wave away. But suppose Q1's 80 ticks came from a quarter in which the right normalizing base was higher and Q2's 95 from a tighter, more concentrated wave of launchers. Normalizing by the count of firms that were actually active in each quarter tells a different story.
| Quarter | Novel events (raw) | Active firms | Events per active firm | Mean CAR per event | Clock signal (per firm × CAR) |
|---|---|---|---|---|---|
| Q1 | 30 | 50 | 0.60 | +0.55% | 0.0033 |
| Q2 | 45 | 50 | 0.90 | +0.55% | 0.0050 |
Counting only the genuinely novel ticks (30 versus 45, after the novelty filter strips reprints and boilerplate from the raw 80 and 95) and normalizing per active firm, the per-firm cadence rises from 0.60 to 0.90, a 50% acceleration. Multiplying by the mean per-event CAR of about +0.55% gives a count-times-impact clock signal that climbs from 0.0033 to 0.0050. The raw count (80 to 95, a 19% bump) understated the move and mixed in coverage noise; the normalized, novelty-filtered, impact-weighted series is what actually measures the clock. This operationalizes the count-times-impact mnemonic: frequency per active firm sets the pace, mean CAR sets the loudness, and only their product is the reading.
Confounders, clustering, and significance tests
Confounders are a real concern for product news: earnings, guidance, analyst revisions, M&A, recalls, and clustered rival announcements frequently coincide with launches. The classic instruction was to screen the window and delete contaminated events, but the modern evidence calls for retain-and-classify rather than reflexive deletion. Sorescu, Warren and Ertekin (2017), using RavenPack data on 3,982 US firms over 2000 to 2013, find that in short three-day windows the difference between the full sample and the confounder-purged sample is statistically insignificant, so deleting confounded observations is generally unnecessary and risks selection bias. Warren and Sorescu (2017) go further: new-product news released concurrently with other good corporate news can produce a combined reaction larger than the sum of its parts (super-additive), so concurrency is sometimes informative rather than mere contamination. This is especially load-bearing here, because the page's own thesis is that clockspeed news clusters with other corporate news. The recommended practice is therefore to classify event types with CATA and keep the observations (flagging concurrency), rather than discard them. A practical recipe is a Factiva or newswire keyword screen of the window for earnings, guidance, dividends, M&A, analyst-revision, recall, litigation, and major-contract items, used to tag rather than blanket-delete; and, distinctly, screening the 120-to-250-day estimation window for unrelated events that would bias alpha and beta and inflate the residual variance used to standardize, which is a contamination source that weakens every test and is rarely handled.
There is also a second, separate clustering problem specific to fast-clockspeed samples. The calendar-time cross-sectional correlation handled below (rivals launching on the same day) is one axis; the other is within-firm correlation from serial launchers. Fast-clockspeed firms ship repeatedly, so the same firm contributes many events whose abnormal returns share a common firm-level component, and treating them as independent observations overstates precision. Following Petersen (2009), cluster standard errors by firm (not only by event date) when a serial launcher appears many times in the sample. Relatedly, dense event flow makes one event's estimation window overlap another event's reaction window, contaminating the alpha and beta used as the benchmark; an explicit estimation-window-overlap screen on the 120-to-250-day window is the remedy.
How big is the clustering problem? Fast-clockspeed industries pose a specific threat: rivals tend to launch together, so events cluster in calendar time and overlap, inducing cross-sectional correlation among abnormal returns. This is not a minor nuisance. Kolari and Pynnonen (2010) show that under event-date clustering, even low cross-sectional correlation makes the Patell Z test over-reject a true null by up to about 200% (roughly triple the nominal 5% rate). A naive significance count would therefore manufacture false "dynamism." Their adjusted-BMP factor, tKP = tBMP × sqrt((1 - r̄) / (1 + (N - 1)r̄)), restores correct size. The right default for clockspeed samples is the generalized rank test GRANK (Kolari and Pynnonen, 2011), which is simultaneously robust to event-induced volatility, abnormal-return serial correlation, and cross-sectional correlation from clustering, with higher empirical power than popular parametric tests for both single-day and cumulative abnormal returns.
Build the test battery up in layers. Because new-product launches are themselves high-variance events, start from the standardized cross-sectional test of Boehmer, Musumeci and Poulsen (1991) (BMP), which corrects the Patell test's over-rejection under event-induced variance; raw Patell Z is the wrong baseline for news spikes. BMP still over-rejects under clustering, which is what the Kolari-Pynnonen adjustment and GRANK fix on top. Add non-parametric rank and sign tests as robustness. The full battery is described in Significance Tests. Because frequent news creates overlapping windows, prefer short windows in dense industries.
Statistical power is the binding constraint
The defining feature of a clockspeed monitor is not bias but low power. Per-event new-product CARs are about +0.4% to +0.75% (Chaney et al., 1991), small relative to daily idiosyncratic volatility, so any single-event test is nearly hopeless and the whole monitor is a low-signal problem solved by aggregation and multiple detectors. Four responses follow. First, prefer standardized tests (BMP, and GRANK for clustered samples) over raw CARs, which weight each observation by its precision. Second, lean on non-parametric rank and sign tests, which retain power under the non-normal, fat-tailed return distributions news events produce. Third, use abnormal volume and abnormal volatility as sign-independent second detectors: they fire on information arrival regardless of the return sign, so they catch events that a return test misses. Fourth, aggregate to the industry-quarter to gain N, which is the level at which the clockspeed series actually lives. Frame the entire monitor this way: a single firm-event tells you almost nothing, but a few hundred clustered into an industry-quarter, tested with the right statistic and cross-checked against volume, is a reliable reading of the clock.
Volume as a second detector, and persistence versus reversal
Abnormal trading volume is a complementary and often cleaner event detector than abnormal return, because it responds to information arrival regardless of sign (Tetlock, 2007). Raw daily volume is strongly right-skewed and non-normal, so it must be log-transformed before testing. Our Abnormal Volume Calculator (AVC) implements the standard log relative-volume measure Vit = log(nit × 100 / Sit + 0.000255), where n is shares traded and S is shares outstanding, with the small constant 0.000255 added before the log so that zero-volume days remain defined. The mean-adjusted model is the default; market and EGLS models are available but need more data. Campbell and Wasley (1996) show that a non-parametric test on log volume is more powerful than the parametric test for detecting abnormal volume, with the advantage largest on NASDAQ securities, where many fast-clockspeed technology firms trade; Ajinkya and Jain (1989) establish the log transform as the right specification for daily volume. This makes "volume as a second detector" a cited, tooling-matched claim rather than an assertion. Finally, distinguish permanent repricing from attention-driven mean reversion: pure attention and sentiment spikes revert (Tetlock, 2007; Da, Engelberg and Gao, 2011), whereas identified fundamental news drifts (Boudoukh et al., 2019; Chan, 2003), subject to the decay caveat above. Sentiment should be scored with finance-domain models (a finance-specific dictionary as a transparent baseline per Loughran and McDonald, 2011, or a transformer model such as FinBERT per Huang, Wang and Yang, 2023) and reported separately from volume, since the two carry distinct return signatures.
Two estimators for two questions
The monitor asks two different questions that call for two different estimators. To price a single industry-quarter spike, run the cross-sectional CAR battery (BMP and GRANK) on the firm-events in that spike. To read the longitudinal trend, a calendar-time portfolio (CTP) approach is cleaner: form an industry portfolio in event time, regress its returns on factors, and read dynamism off the time series. CTP is robust to cross-sectional event clustering by construction, which is exactly the problem that plagues the cross-sectional battery in fast-clockspeed samples, so it is the better tool for the trend while the cross-sectional tests price each spike.
Causal-inference and multiple-testing caveats
Two candid rigor notes keep the monitor honest. First, the count-times-impact series is associational, not a clean causal disruption estimate. Goldsmith-Pinkham and Lyu (2025) identify the three binding threats for financial event studies, and a clustered rival-event monitor violates all of them directly: non-random event timing (selection), market-wide shocks that induce cross-firm dependence, and SUTVA violations or spillovers where one firm's event re-prices rivals and the aggregate reaction scales with how many firms are treated. Read a rising series as a dynamism proxy, not as a causal estimate of disruption, unless selection and spillovers are explicitly addressed. Second, because the monitor runs many industry-quarter tests, control the false-discovery rate across the panel (for example with the Benjamini-Hochberg procedure) so that the inevitable handful of "significant" spikes among thousands of tests are not over-interpreted as real acceleration.
Run it with our tools
Clockspeed monitoring sits at the intersection of our two distinctive assets, news analytics and abnormal-return measurement, and the applications on this site implement the count-then-quantify pipeline end to end:
News Analytics (CATA) is the front of the pipeline. It classifies and extracts event types from a news or press-release corpus and scores sentiment, relevance, and novelty, producing the per-industry event counts that form the clockspeed series (the Figure 6 machinery). Novelty filtering here is what keeps reprints from inflating the count, and event-type classification is what lets you keep and tag concurrent news rather than blanket-delete it.
Event Date Identifier (EDI) pins down the first public disclosure date for each event, the most important data-quality decision for product and news events where the value-relevant date precedes the ship date.
Abnormal Return Calculator (ARC) quantifies the market impact of the individual events. Supply an event file keyed to the news date, choose your estimation and event windows (a short (-1,+1) for the immediate reaction and a separate post-event window for drift), pick an expected-return model (Market Model, CAPM, Fama-French 3-factor, Fama-French 5-factor, Carhart 4-factor, or comparison-period mean), and run the parametric and non-parametric tests built to handle the clustered, calendar-bunched samples that fast-clockspeed industries produce. Grouping events by industry-quarter reproduces the count-times-impact proxy.
Abnormal Volume Calculator (AVC) measures the volume reaction with the log relative-volume model described above, an independent and often more robust marker of an information event than returns alone. Abnormal Volatility Calculator (AVyC) captures the volatility response, which the news-analytics literature ties most strongly to identified firm-specific news.
A Monday-morning workflow.
- CATA builds the quarterly per-SIC/NAICS news-event series and flags an industry-quarter spike, say an AI software sub-sector accelerating.
- Normalize the count per active firm and novelty-filter to drop vaporware and reprints (Sorescu et al., 2007), so only substantive clock ticks remain.
- EDI pins the first-disclosure date for each underlying announcement.
- ARC prices the firm-events grouped into the industry-quarter (benchmark against the +0.3% to +0.75% three-day CARs), with BMP and GRANK to survive the clustering; AVC confirms abnormal volume and AVyC abnormal volatility as sign-independent corroboration.
- A Boudoukh-style drift-versus-reversal test on a (+2,+20) window decides whether the spike is a permanent clock tick or attention noise, read against the decay caveat.
Who uses this in practice
Industry clockspeed and news-flow monitoring is run today by four distinct practitioner communities, and a notable gap in the market is that the leading academic event-study competitor publishes nothing on clockspeed, dynamism, disruption, or news analytics at all. Each persona maps onto the same CATA to EDI to ARC/AVC pipeline.
Quantitative and systematic funds
News-flow alpha and risk management is the largest commercial use. RavenPack's "Event Buzz" signal, abnormal news volume, is the direct commercial twin of this page's "count" step, and in RavenPack's own research notes, combining extreme sentiment with high Event Buzz is reported to lift annualized returns from about 9.6% to about 15.5% in large and mid caps (information ratio about 1.74 to 2.04) and from about 25.2% to about 45.5% in small caps (information ratio about 2.73 to 3.68), with per-trade returns up to roughly double (vendor figures, not independently replicated here). News analytics of this kind is reportedly used by more than 70% of the best-performing quantitative hedge funds and asset managers, drawing on tens of thousands of sources. This is the count-then-quantify pipeline running commercially at scale, mapped here onto CATA (detect and score) plus ARC and AVC (impact).
Corporate strategy and competitive intelligence
Strategy and competitive-intelligence teams use a measured industry clockspeed to set their own launch cadence: the optimal pace of a firm's new-product introductions rises with industry clockspeed (Souza, Bayus and Wagner, 2004; Carrillo, 2005), so a CI team that monitors the rival panel through CATA can tell whether it is keeping pace or falling behind, and time its own announcements accordingly.
Consultants and sell-side analysts
Management consultants and equity analysts use the count-times-impact series as an industry-dynamism and disruption diagnostic: a rising, well-priced series is direct evidence of accelerating competition, which feeds industry-attractiveness and disruption assessments in strategy decks and sector notes.
Litigators and regulators
In US securities-fraud litigation, a statistically significant event-date abnormal return is treated by courts as the measure of price impact and the basis for damages, while an insignificant return fails the plaintiff's burden. The decisive moment is class certification: under Halliburton Co. v. Erica P. John Fund (Halliburton II, 2014), defendants may rebut the fraud-on-the-market reliance presumption by showing an alleged misstatement had no price impact, and the event study is the instrument both sides bring to that fight. The method itself is admissible under the Daubert standard (it is tested, peer-reviewed, has a known error rate, and is generally accepted), which makes a transparent, replicable abnormal-return calculation directly usable in expert testimony and regulatory analysis, exactly where proprietary, black-box methods are most vulnerable to challenge.
Commercial versus build-your-own. Closed platforms such as RavenPack and Bloomberg run the same count-then-quantify logic, but their methodology is proprietary. Our ARC, AVC, AVyC, CATA, and EDI stack is free and academically transparent, with auditable models and citable methods. For research, strategy decks, and especially expert-witness and regulatory work where method transparency is exactly what the Daubert standard and a Halliburton II price-impact rebuttal demand, a transparent stack is an advantage, not a compromise. It is also a genuine gap: the leading academic event-study competitor publishes nothing on clockspeed, dynamism, disruption, or news analytics, so the applied use case has no authoritative incumbent treatment.
Common pitfalls and misconceptions
"More press releases means a faster clockspeed." False without normalization. Media coverage grows on its own; divide counts by the number of active firms or by total news volume, and novelty-filter reprints, before reading any acceleration.
"Clockspeed equals volatility." No. Volatility is unsigned dispersion; clockspeed is the rate of value-relevant events. News does drive volatility (Boudoukh et al., 2019: about 49.6% of overnight idiosyncratic volatility), but the monitor counts events and prices them, it does not read clockspeed off variance.
"A news count measures clockspeed." It measures product clockspeed only, not the process and organizational dimensions of Mendelson and Pillai (1999), and component-level and system-level clockspeeds can diverge (Dedehayir and Makinen, 2011).
"Always delete confounded events." In short windows this is unnecessary and risks selection bias (Sorescu, Warren and Ertekin, 2017), and concurrent news can be super-additive rather than contaminating (Warren and Sorescu, 2017). Classify and tag with CATA instead of reflexively deleting.
"Use the ship date." Use the first public disclosure (preannouncement or newswire mention), which is where the value-relevant information arrives; EDI handles this reconciliation.
"A falling CD index means the clock is slowing." No. The Consolidation-Disruption (CD) index measures whether new work displaces prior work in a citation network, not the market rate of value-relevant events. The economy-wide decline in CD-index disruptiveness is a statement about how innovations relate to predecessors, not about how fast value-relevant news arrives or how the market prices it. The clockspeed monitor reads market events; do not conflate the two metrics.
"Date it on the day the press release crossed." Many releases cross after the close and are priced the next session (Berkman and Truong, 2009). Shift day 0 to the next trading day, or include day +1 when the intraday timestamp is unknown, or the reaction lands outside your window.
FAQ
What is industry clockspeed, in one sentence?
It is the rate at which an industry renews its products, processes, and organizational structures (Fine, 1998); this page measures the product dimension as the normalized frequency of genuinely novel, value-relevant news events, weighted by their abnormal-return and volume impact.
How is a clockspeed monitor different from just tracking volatility?
Volatility is unsigned dispersion and includes no-news noise; a clockspeed monitor counts identified value-relevant events and prices them. The two are related (identified news explains about 49.6% of overnight idiosyncratic volatility, versus about 12.4% intraday, per Boudoukh et al., 2019), but the monitor reads events, not variance.
What counts as one clock tick?
A single genuinely novel, value-relevant event (a new-product introduction, R&D milestone, partnership, or launch) dated at first public disclosure. Syndicated reprints and boilerplate are filtered out by the novelty score, and vaporware preannouncements (which destroy value) are flagged rather than counted as positive ticks.
What abnormal return should I expect per event?
About +0.75% over three days for genuinely new products and about +0.4% for updates (Chaney et al., 1991), larger in R&D-intensive sectors; modern text-classified samples confirm about +29 to 30 basis points two-day (Mukherjee et al., 2024). These are small relative to daily volatility, which is why aggregation and standardized tests matter, and they are not stable constants (drift has attenuated over time).
Which tool does what?
CATA counts, classifies, and scores the news; EDI dates the first disclosure; ARC prices the return reaction; AVC measures abnormal volume and AVyC abnormal volatility as sign-independent second detectors.
Why normalize the counts?
Because media coverage grows independently of innovation. Dividing by active firms or total news volume, and novelty-filtering, prevents mistaking rising press-release volume for an accelerating clock.
How many events do I need?
More than intuition suggests, because per-event new-product CARs (about +0.4% to +0.75%) are small relative to daily idiosyncratic volatility, so power, not bias, is the binding constraint. A single firm-event tells you almost nothing; a few hundred clustered into an industry-quarter, tested with standardized statistics (BMP, and GRANK for clustered samples) and cross-checked against abnormal volume and volatility, is a reliable reading. When N is thin, lean on the sign-independent volume and volatility detectors and aggregate to the industry-quarter, which is the level at which the clockspeed series actually lives.
Does this only work for fast-clockspeed industries?
No. Fast sectors (software, semiconductors, AI) give you high frequency but each tick is small, so the series is about cadence. Slow sectors (biotech, pharma, autos, utilities) give you rare but often large ticks, so the per-event impact carries the signal and dating (an EDI-identified first disclosure) matters most. The count-times-impact framing is built precisely so that the same monitor reads both regimes: it is the product of the two factors, not either one alone, that measures the clock.
Is a news count the same as measuring innovation?
No, and conflating them is a common error. A news count measures the rate at which value-relevant events reach the market (and only the product dimension of clockspeed, per Mendelson and Pillai, 1999). It is not a patent count, an R&D-spend measure, or a citation-network disruptiveness score; those answer different questions. The monitor's claim is narrower and more tractable: how fast value-relevant news arrives and how strongly the market prices it.
My data is in SIC codes but I need NAICS or GICS. Does that matter?
Yes, for comparability. The legacy Figure 6 series are keyed to SIC codes; for current cross-market work, map SIC to NAICS or GICS using a published concordance before comparing across industries, because the classification boundaries differ. Keep the mapping explicit and consistent across quarters, since a silent reclassification can masquerade as a jump in the clock. CATA's per-industry counts can be aggregated under whichever scheme you standardize on.
Related use cases
Clockspeed monitoring shares its analytical core with several sibling applications. The rival-spillover mechanics central to "industry dynamism" are treated in depth in Competitive Dynamics; the discrete corporate events that populate a clockspeed series are covered in Mergers and Acquisitions, Alliances and Joint Ventures, Divestitures, and Earnings Announcements. The use of news-derived and drift signals to drive allocation appears in Investment Strategies and Tactical Asset Allocation Signals, and the cross-industry comparison logic behind Figure 6 is generalized in Comparative Event-Type Analyses. For the full catalogue, return to the Practical Applications overview.
References
- Ajinkya, B. B., and P. C. Jain. 1989. "The behavior of daily stock market trading volume." Journal of Accounting and Economics, 11(4): 331-359. https://doi.org/10.1016/0165-4101(89)90018-9
- Ball, C. A., and W. N. Torous. 1988. "Investigating security-price performance in the presence of event-date uncertainty." Journal of Financial Economics, 22(1): 123-153. https://doi.org/10.1016/0304-405X(88)90025-6
- Bayus, B. L. 1994. "Are product life cycles really getting shorter?" Journal of Product Innovation Management, 11(4): 300-308. https://doi.org/10.1016/0737-6782(94)90085-X
- Bayus, B. L., S. Jain, and A. G. Rao. 2001. "Truth or consequences: An analysis of vaporware and new product announcements." Journal of Marketing Research, 38(1): 3-13. https://doi.org/10.1509/jmkr.38.1.3.18834
- Berkman, H., and C. Truong. 2009. "Event day 0? After-hours earnings announcements." Journal of Accounting Research, 47(1): 71-103. https://doi.org/10.1111/j.1475-679X.2008.00312.x
- Boehmer, E., J. Musumeci, and A. B. Poulsen. 1991. "Event-study methodology under conditions of event-induced variance." Journal of Financial Economics, 30(2): 253-272. https://doi.org/10.1016/0304-405X(91)90032-F
- Boudoukh, J., R. Feldman, S. Kogan, and M. Richardson. 2019. "Information, trading, and volatility: Evidence from firm-specific news." Review of Financial Studies, 32(3): 992-1033. https://doi.org/10.1093/rfs/hhy083
- Brown, S. J., and J. B. Warner. 1985. "Using daily stock returns: The case of event studies." Journal of Financial Economics, 14(1): 3-31. https://doi.org/10.1016/0304-405X(85)90042-X
- Bybee, L., B. Kelly, A. Manela, and D. Xiu. 2024. "Business news and business cycles." Journal of Finance, 79(5): 3105-3147. https://doi.org/10.1111/jofi.13377
- Campbell, C. J., and C. E. Wasley. 1996. "Measuring abnormal daily trading volume for samples of NYSE/AMEX and NASDAQ securities using parametric and nonparametric test statistics." Review of Quantitative Finance and Accounting, 6(3): 309-326. https://doi.org/10.1007/BF00245187
- Carrillo, J. E. 2005. "Industry clockspeed and the pace of new product development." Production and Operations Management, 14(2): 125-141. https://doi.org/10.1111/j.1937-5956.2005.tb00014.x
- Chan, W. S. 2003. "Stock price reaction to news and no-news: Drift and reversal after headlines." Journal of Financial Economics, 70(2): 223-260. https://doi.org/10.1016/S0304-405X(03)00146-6
- Chaney, P. K., T. M. Devinney, and R. S. Winer. 1991. "The impact of new product introductions on the market value of firms." Journal of Business, 64(4): 573-610. https://doi.org/10.1086/296552
- Chordia, T., A. Subrahmanyam, and Q. Tong. 2014. "Have capital market anomalies attenuated in the recent era of high liquidity and trading activity?" Journal of Accounting and Economics, 58(1): 41-58. https://doi.org/10.1016/j.jacceco.2014.06.001
- Da, Z., J. Engelberg, and P. Gao. 2011. "In search of attention." Journal of Finance, 66(5): 1461-1499. https://doi.org/10.1111/j.1540-6261.2011.01679.x
- Das, S. R. 2014. "News analytics: Framework, techniques and metrics." In The Handbook of News Analytics in Finance (Wiley). https://doi.org/10.2139/ssrn.1814258
- Dedehayir, O., and S. J. Makinen. 2011. "Measuring industry clockspeed in the systemic industry context." Technovation, 31(12): 627-637. https://doi.org/10.1016/j.technovation.2011.08.004
- DiMasi, J. A. 2016. "Competitive development in pharmacologic classes: Market entry and the timing of development." Clinical Pharmacology & Therapeutics, 100(6): 754-760 (and McKinsey, "Pharma's first-to-market advantage," 2014). https://doi.org/10.1002/cpt.502
- Fine, C. H. 1998. Clockspeed: Winning Industry Control in the Age of Temporary Advantage. Reading, MA: Perseus Books.
- Goldsmith-Pinkham, P., and Y. Lyu. 2025. "Causal inference in financial event studies." Working paper, arXiv:2511.15123. https://arxiv.org/abs/2511.15123
- Huang, A. H., H. Wang, and Y. Yang. 2023. "FinBERT: A large language model for extracting information from financial text." Contemporary Accounting Research, 40(2): 806-841. https://doi.org/10.1111/1911-3846.12832
- Innosight. 2021. 2021 Corporate Longevity Forecast. Innosight Executive Briefing. https://www.innosight.com/insight/creative-destruction/
- Kolari, J. W., and S. Pynnonen. 2010. "Event study testing with cross-sectional correlation of abnormal returns." Review of Financial Studies, 23(11): 3996-4025. https://doi.org/10.1093/rfs/hhq072
- Kolari, J. W., and S. Pynnonen. 2011. "Nonparametric rank tests for event studies." Journal of Empirical Finance, 18(5): 953-971. https://doi.org/10.1016/j.jempfin.2011.08.003
- Lang, L. H. P., and R. M. Stulz. 1992. "Contagion and competitive intra-industry effects of bankruptcy announcements: An empirical analysis." Journal of Financial Economics, 32(1): 45-60. https://doi.org/10.1016/0304-405X(92)90024-R
- Singh, M., R. Rocafort, C. Cai, K. W. Siah, and A. W. Lo. 2022. "The reaction of sponsor stock prices to clinical trial outcomes: An event study analysis." PLOS ONE, 17(9): e0272851. https://doi.org/10.1371/journal.pone.0272851
- Lopez-Lira, A., and Y. Tang. 2023. "Can ChatGPT forecast stock price movements? Return predictability and large language models." Working paper, arXiv:2304.07619. https://arxiv.org/abs/2304.07619
- Loughran, T., and B. McDonald. 2011. "When is a liability not a liability? Textual analysis, dictionaries, and 10-Ks." Journal of Finance, 66(1): 35-65. https://doi.org/10.1111/j.1540-6261.2010.01625.x
- MacKinlay, A. C. 1997. "Event studies in economics and finance." Journal of Economic Literature, 35(1): 13-39. https://www.jstor.org/stable/2729691
- Mendelson, H., and R. R. Pillai. 1999. "Industry clockspeed: Measurement and operational implications." Manufacturing & Service Operations Management, 1(1): 1-20. https://doi.org/10.1287/msom.1.1.1
- Mukherjee, A., B. Pellegrino, A. Zaldokas, Y. Ren, and T. Thornquist. 2024. "New products." Working paper (NBER conference draft). https://conference.nber.org/conf_papers/f211342.pdf
- Nadkarni, S., and V. K. Narayanan. 2007. "Strategic schemas, strategic flexibility, and firm performance: The moderating role of industry clockspeed." Strategic Management Journal, 28(3): 243-270. https://doi.org/10.1002/smj.576
- Pauwels, K., J. Silva-Risso, S. Srinivasan, and D. M. Hanssens. 2004. "New products, sales promotions, and firm value: The case of the automobile industry." Journal of Marketing, 68(4): 142-156. https://doi.org/10.1509/jmkg.68.4.142.42724
- Petersen, M. A. 2009. "Estimating standard errors in finance panel data sets: Comparing approaches." Review of Financial Studies, 22(1): 435-480. https://doi.org/10.1093/rfs/hhn053
- Sood, A., and G. J. Tellis. 2009. "Do innovations really pay off? Total stock market returns to innovation." Marketing Science, 28(3): 442-456. https://doi.org/10.1287/mksc.1080.0407
- Sorescu, A., V. Shankar, and T. Kushwaha. 2007. "New product preannouncements and shareholder value: Don't make promises you can't keep." Journal of Marketing Research, 44(3): 468-489. https://doi.org/10.1509/jmkr.44.3.468
- Sorescu, A. B., and J. Spanjol. 2008. "Innovation's effect on firm value and risk: Insights from consumer packaged goods." Journal of Marketing, 72(2): 114-132. https://doi.org/10.1509/jmkg.72.2.114
- Sorescu, A., N. L. Warren, and L. Ertekin. 2017. "Event study methodology in the marketing literature: An overview." Journal of the Academy of Marketing Science, 45(2): 186-207. https://doi.org/10.1007/s11747-017-0516-y
- Souza, G. C., B. L. Bayus, and H. M. Wagner. 2004. "New-product strategy and industry clockspeed." Management Science, 50(4): 537-549. https://doi.org/10.1287/mnsc.1030.0172
- Tetlock, P. C. 2007. "Giving content to investor sentiment: The role of media in the stock market." Journal of Finance, 62(3): 1139-1168. https://doi.org/10.1111/j.1540-6261.2007.01232.x
- Warren, N. L., and A. Sorescu. 2017. "When 1 + 1 > 2: How investors react to new product releases announced concurrently with other corporate news." Journal of Marketing, 81(6): 64-82. https://doi.org/10.1509/jm.15.0275
See the full bibliography for all sources cited across the site.