In short: event studies are widely used in securities litigation and damages analysis to measure whether and how much a disclosure or corrective event moved a stock, by computing abnormal returns around the event date. This page covers the litigation use case and how to run it. Run it free in ARC.
In securities-fraud litigation under Rule 10b-5, the event study is the courts' standard tool for deciding whether an alleged misrepresentation or its later correction actually moved a stock's price, by how much, and how much of that movement is attributable to the fraud rather than to unrelated news. The Second Circuit called it "an accepted method for the evaluation of materiality damages to a class of plaintiffs in a defendant corporation's securities" and treated it as standard operating procedure in federal securities litigation (In re Vivendi, 2016). After Basic v. Levinson (1988) established the fraud-on-the-market presumption, the event study became the empirical engine for the three contested elements of a 10b-5 claim: materiality (did the information matter to the price), loss causation (did the corrective disclosure cause the loss), and damages (the per-share inflation carried across the class period). Since Halliburton II (2014), it is also the focal battleground at class certification, where defendants may rebut reliance with event-study evidence of no price impact. The methodology is the right tool here for the same reason it is everywhere else (it isolates the firm-specific abnormal return after stripping out market and industry movements), but litigation pushes it into its hardest regime: a single firm on a single day, where the statistical guarantees that hold for large multi-firm academic samples no longer transfer cleanly. Getting that regime right is what "correct use" means.
Why event studies are the litigation standard
The bridge from financial economics to securities-fraud law was built by Mitchell and Netter (1994), who showed that the efficient-markets hypothesis and the event study together give 10b-5 practice a rigorous empirical basis for establishing materiality and computing damages, and documented the SEC's early adoption of the technique in enforcement. The doctrinal scaffolding it serves is a short chain of Supreme Court decisions:
- Basic Inc. v. Levinson (1988) adopted the fraud-on-the-market presumption: in an efficient market, the price reflects public information, so a plaintiff who bought at a market price is presumed to have relied on any material misrepresentation. Materiality is operationalized as a statistically significant abnormal return in an efficient market.
- Dura Pharmaceuticals v. Broudo (2005) held that loss causation requires a price drop tied to the corrective disclosure of the relevant truth, not merely inflation at the time of purchase. This makes the corrective-disclosure event study, with confounding news removed, the analytic core of the loss-causation element.
- Comcast Corp. v. Behrend (2013) required that a class-wide damages model be tied to the liability theory and capable of common proof, the standard a litigation event study must satisfy.
- Halliburton II (2014) preserved Basic but let defendants rebut the reliance presumption at class certification with event-study evidence of no price impact, turning class cert into a contest of opposing event studies.
- Goldman Sachs v. Arkansas Teacher Retirement System (2021) held that the generic nature of an alleged misstatement is important price-impact evidence: a mismatch between a vague statement and a specific later corrective disclosure undercuts the inflation-maintenance theory. It also placed the burden of persuasion on defendants to show no price impact by a preponderance.
The defining methodological tension runs underneath all of this. The event study was developed for and validated on large multi-firm samples, where averaging abnormal returns across many firms delivers statistical power and the central limit theorem justifies the t-test. A litigation study is a single-firm, single-event study, a design essentially absent from the peer-reviewed finance literature (Brav and Heaton, 2015). Applied to one firm on one day, the standard market-model t-test is both low-powered (it fails to detect real frauds, a Type II problem) and, in turbulent markets, oversized (it flags noise as significant, a Type I problem), because daily abnormal returns are fat-tailed and non-normal. The sections below set out what the research shows about this regime and how to run a study that survives scrutiny.
What the research shows
Four facts dominate the modern literature on litigation event studies: daily single-firm abnormal returns are sharply non-normal, single-firm studies have low power, the conventional 95% threshold is a contestable policy choice rather than a scientific default, and confounding news does not average away as it does in a multi-firm study.
Single-firm abnormal returns are non-normal and fat-tailed
The standard t-test assumes the event-date abnormal return is drawn from a normal distribution. Gelbach, Helland and Klick (2013), using 2000 to 2007 CRSP data, report that the pooled distribution of daily excess returns is sharply non-normal, with very high excess kurtosis relative to the value of 3.0 expected under normality. Normality is decisively rejected. The consequence is that the conventional t-test has the wrong Type I and Type II error rates in single-firm settings: the critical value of 1.96 does not correspond to a true 5% false-positive rate. The authors propose a distribution-free remedy, the sample-quantile (SQ) test, which fixes Type I error at any chosen level by taking the critical value from the empirical quantile of the firm's own pre-event (estimation-window) residuals rather than from a normal table. Baker (2016) shows the problem is worst in high-volatility regimes (the 2008 to 2009 financial crisis), where the standard model over-rejects: empirical rejection frequencies exceed the nominal 5%, so Type I error rises precisely when markets are turbulent, and even proposed fixes do not fully correct the bias.
Single-firm studies have low statistical power
With one firm and one date there is no cross-sectional averaging, so even economically large frauds can fail to produce a statistically significant abnormal return. Brav and Heaton (2015) make this the central critique: single-firm studies have low power to detect real frauds, and courts wrongly treat the non-rejection of the null as affirmative proof of no price impact. Fisch and Gelbach (2021) quantify the power-versus-confidence tradeoff: requiring 95% confidence yields very low power for typical single-firm studies, so valid claims are erroneously rejected. For a high-volatility firm of roughly $4 billion in market capitalization, reaching 80% power can require the corrective disclosure to wipe out several hundred million dollars of value. Power scales with firm size and falls with idiosyncratic volatility, so high-volatility small caps are nearly untestable, and the "minimum detectable" significant abnormal return for an average firm is often on the order of 3% to 3.5%.
The 95% threshold is a policy choice, not a scientific default
The conventional litigation test uses a two-sided 95% confidence level, requiring an absolute t-statistic of at least 1.96 on the event-date abnormal return. That threshold was imported from academic multi-firm practice, not derived from any legal standard of proof. Fisch, Gelbach and Klick (2018) argue that a one-sided (directional) test is appropriate because fraud theory predicts a specific direction (a corrective disclosure should lower the price), which raises power relative to the two-sided test and shifts the 5% critical value from 1.96 to 1.645 in absolute terms. They further note that the 95% threshold is a mismatch with the civil preponderance-of-the-evidence standard (more likely than not, that is, greater than 50%), which does not map to a 5% false-positive rate. Fisch and Gelbach (2021) develop the normative point: the significance level is a policy judgment balancing the cost of false positives (over-deterrence) against false negatives (under-enforcement), and it should arguably be calibrated to firm market cap and the abnormal-return distribution rather than reflexively fixed at 5%.
Confounders do not average away, and significance is not magnitude
In a multi-firm academic study, idiosyncratic confounding news on each firm's event day washes out across the sample. In a single-firm study it does not, so an unadjusted single-firm abnormal return can be biased, often upward, toward larger detected impact and larger damages (Brav and Heaton, 2015). Isolating the fraud-related component is therefore the analytic heart of loss causation. A second, distinct point is that statistical significance and economic magnitude are separate inferential questions (Tabak and Dunbar, 1999): testing for the existence of a price effect answers "was there an effect?", while measuring its size, net of confounders, answers "how big, and how much is fraud-related?". A return can be statistically significant yet economically small, or economically large yet insignificant in a volatile firm. Operationally, immaterial information is information that does not produce a statistically significant abnormal return in an efficient market (Dunbar and Heller, 2006), but low power means an insignificant result is not affirmative proof of immateriality.
Intraday data can overturn a daily finding
Price reactions to value-relevant news are extremely fast, on the order of seconds to minutes, which motivates intraday event studies to disentangle same-day confounders. Intraday studies typically detect smaller abnormal returns than daily studies and can reverse a daily "significant" finding. In the worked example below, a daily firm-specific residual of -12% collapses to a non-significant -0.64% once intraday confounders are stripped out, because two unrelated disclosures hit the same trading day. Courts have recognized the use of intraday returns when multiple disclosures occur on one day (Bricklayers v. Credit Suisse; In re Novatel Wireless, admitting an expert's intraday causation analysis after detailed scrutiny).
A structural limit: confirmatory and inflation-maintenance fraud
The event study has a built-in blind spot that "correct use" must disclose. A misstatement that merely maintains an already-inflated price (confirmatory, or inflation-maintenance, fraud) produces no measurable price reaction at the time of the lie, because the lie keeps the price from falling rather than pushing it up. The event-study signal appears only on the later corrective-disclosure date. This is the basis for the contested back-casting of damages, and it is exactly the structure Goldman Sachs (2021) scrutinized: if the alleged misstatement is generic but the corrective disclosure is specific, the mismatch is evidence that the misstatement did not maintain the inflation the plaintiffs claim (Fisch, Gelbach and Klick, 2018).
Why correctness is financially decisive
These are not academic refinements. Event-study-derived investor losses ("plaintiff-style damages") are among the most important predictors of settlement size in securities class actions (Cornerstone Research, 2024), so a methodological choice (one-sided versus two-sided, normal versus SQ critical value, daily versus intraday, confounders in or out) can move the implied damages by tens to hundreds of millions of dollars. Re-running the Halliburton record, Fisch, Gelbach and Klick (2018) show that correcting for one-sided testing, non-normality, and multiple comparisons changes which corrective-disclosure dates register as "significant": correct use changes outcomes.
How to run this kind of event study
The general workflow (estimation window, expected-return model, event window, abnormal returns, significance testing) is covered in our Introduction to Event Study Methodology and the step-by-step Event Study Application Blueprint. Litigation adds several event-type-specific demands that experts must be ready to defend.
Event-date identification: date the disclosure precisely
The event is a specific disclosure: the alleged misrepresentation date or, more commonly, the corrective-disclosure or materialization-of-risk date. Litigation demands precise dating, including the exact time of an 8-K, press release, or analyst report, because same-day confounders are the central threat. When several disclosures hit one day, drop to intraday (1-, 5-, or 15-minute) returns to attribute the move correctly. Our Event Date Identifier (EDI) is built to pin down the true release timestamp.
Windows, model, and the industry control
Estimation windows are typically about 120 to 250 trading days ending before the event. Event windows are kept very short (the event day itself, sometimes [-1,+1] or [0,+1]) to limit confounding and respect market efficiency; longer windows invite both confounding and judicial skepticism. The normal-return model is a market model (single index) or a multi-factor model that adds an industry index (and sometimes Fama-French factors). Controlling for both market and industry is what isolates the firm-specific residual, the only part that can carry fraud-relevant information. See Expected Return Models for the model choices.
Inference: go beyond the plain t-test
Standard practice computes a t-statistic on the event-date residual, often with the Patell (standardized) or Boehmer-Musumeci-Poulsen (BMP) statistic to handle event-window variance changes. Because single-firm daily residuals are non-normal, report distribution-free alternatives alongside the parametric statistic: the Corrado (1989) rank test and the Gelbach-Helland-Klick SQ test, which sets the critical value from the empirical quantile of the estimation-window residuals (Gelbach, Helland and Klick, 2013). State whether you are using a one- or two-sided test and justify it: a one-sided test is defensible when the fraud theory predicts a directional move (Fisch, Gelbach and Klick, 2018). Our Significance Tests page documents the full battery.
Multiple comparisons across disclosure dates
When an expert tests several alleged corrective-disclosure dates (the Halliburton II quote contemplated six discrete events), the family-wise error rate inflates: testing enough dates will turn up a "significant" one by chance. Apply a Holm-Bonferroni-type correction, grouped by legally related claim rather than blanket across all dates (Fisch, Gelbach and Klick, 2018).
Volatility and structural change
The estimation-window variance may not hold in the event window: crisis periods, earnings season, and COVID-era turbulence all spike idiosyncratic volatility and invalidate a critical value calibrated on calmer data, inflating Type I error (Baker, 2016). Model the change with period-specific variance, GARCH-type conditional volatility, or BMP standardization. This is precisely the problem our volatility event-study tool operationalizes.
Confounding control and the fraud-related component
The analyst must read the full news flow on the event day and separate firm-specific corrective information from (a) market and industry moves (handled by the model) and (b) other simultaneous firm news (not handled by the model). Where the corrective disclosure is an earnings correction, decompose the firm-specific residual further to isolate the fraud-related "earnings surprise" using an earnings-response-coefficient (ERC) model, rather than attributing the full residual to the fraud. Where intraday confounders exist, drop to intraday returns to attribute the move.
From abnormal return to damages
The out-of-pocket measure of damages is the per-share artificial inflation at purchase minus the inflation at sale. The event study supplies the per-share inflation ribbon: the corrective-disclosure abnormal price drop, net of confounding (non-fraud) movement, is carried back across the class period to build the inflation at each date. Back-casting is valid only if the corrective disclosure corrects the same information as the alleged misstatement (the Goldman Sachs genericness or "mismatch" inquiry) and confounders are removed, or damages are overstated. Recoverable losses are then capped by the PSLRA 90-day bounce-back (look-back) provision, which limits damages using the average trading price over the 90 days following the corrective disclosure.
Daubert and Rule 702 admissibility
Courts admit event studies under Rule 702 because the technique is testable, peer-reviewed, and has a known error rate. But the single-firm critique (Brav and Heaton, 2015; Baker, 2016) is that the known error rates were derived in multi-firm settings and may not transfer, so a study can be Daubert-admitted yet biased. To survive scrutiny, an expert should disclose the assumed return distribution, report power (not just significance), test the volatility-regime sensitivity, and avoid the inferential overreach of treating an insignificant result as proof of no price impact. Event studies also assume an efficient, liquid market: for thinly traded or inefficient securities the methodology may not apply at all, and that limit should be stated rather than papered over.
Worked example: XYZ Corporation
The following decomposition illustrates why daily data alone can produce a false "material impact" finding and how the firm-specific, fraud-specific, and intraday layers separate.
XYZ Corporation had an alleged corrective disclosure related to an accounting restatement on August 3, 2013 (the event date). On the event date, there was a 21% decline in XYZ's daily stock price, statistically significant at the 1% level.
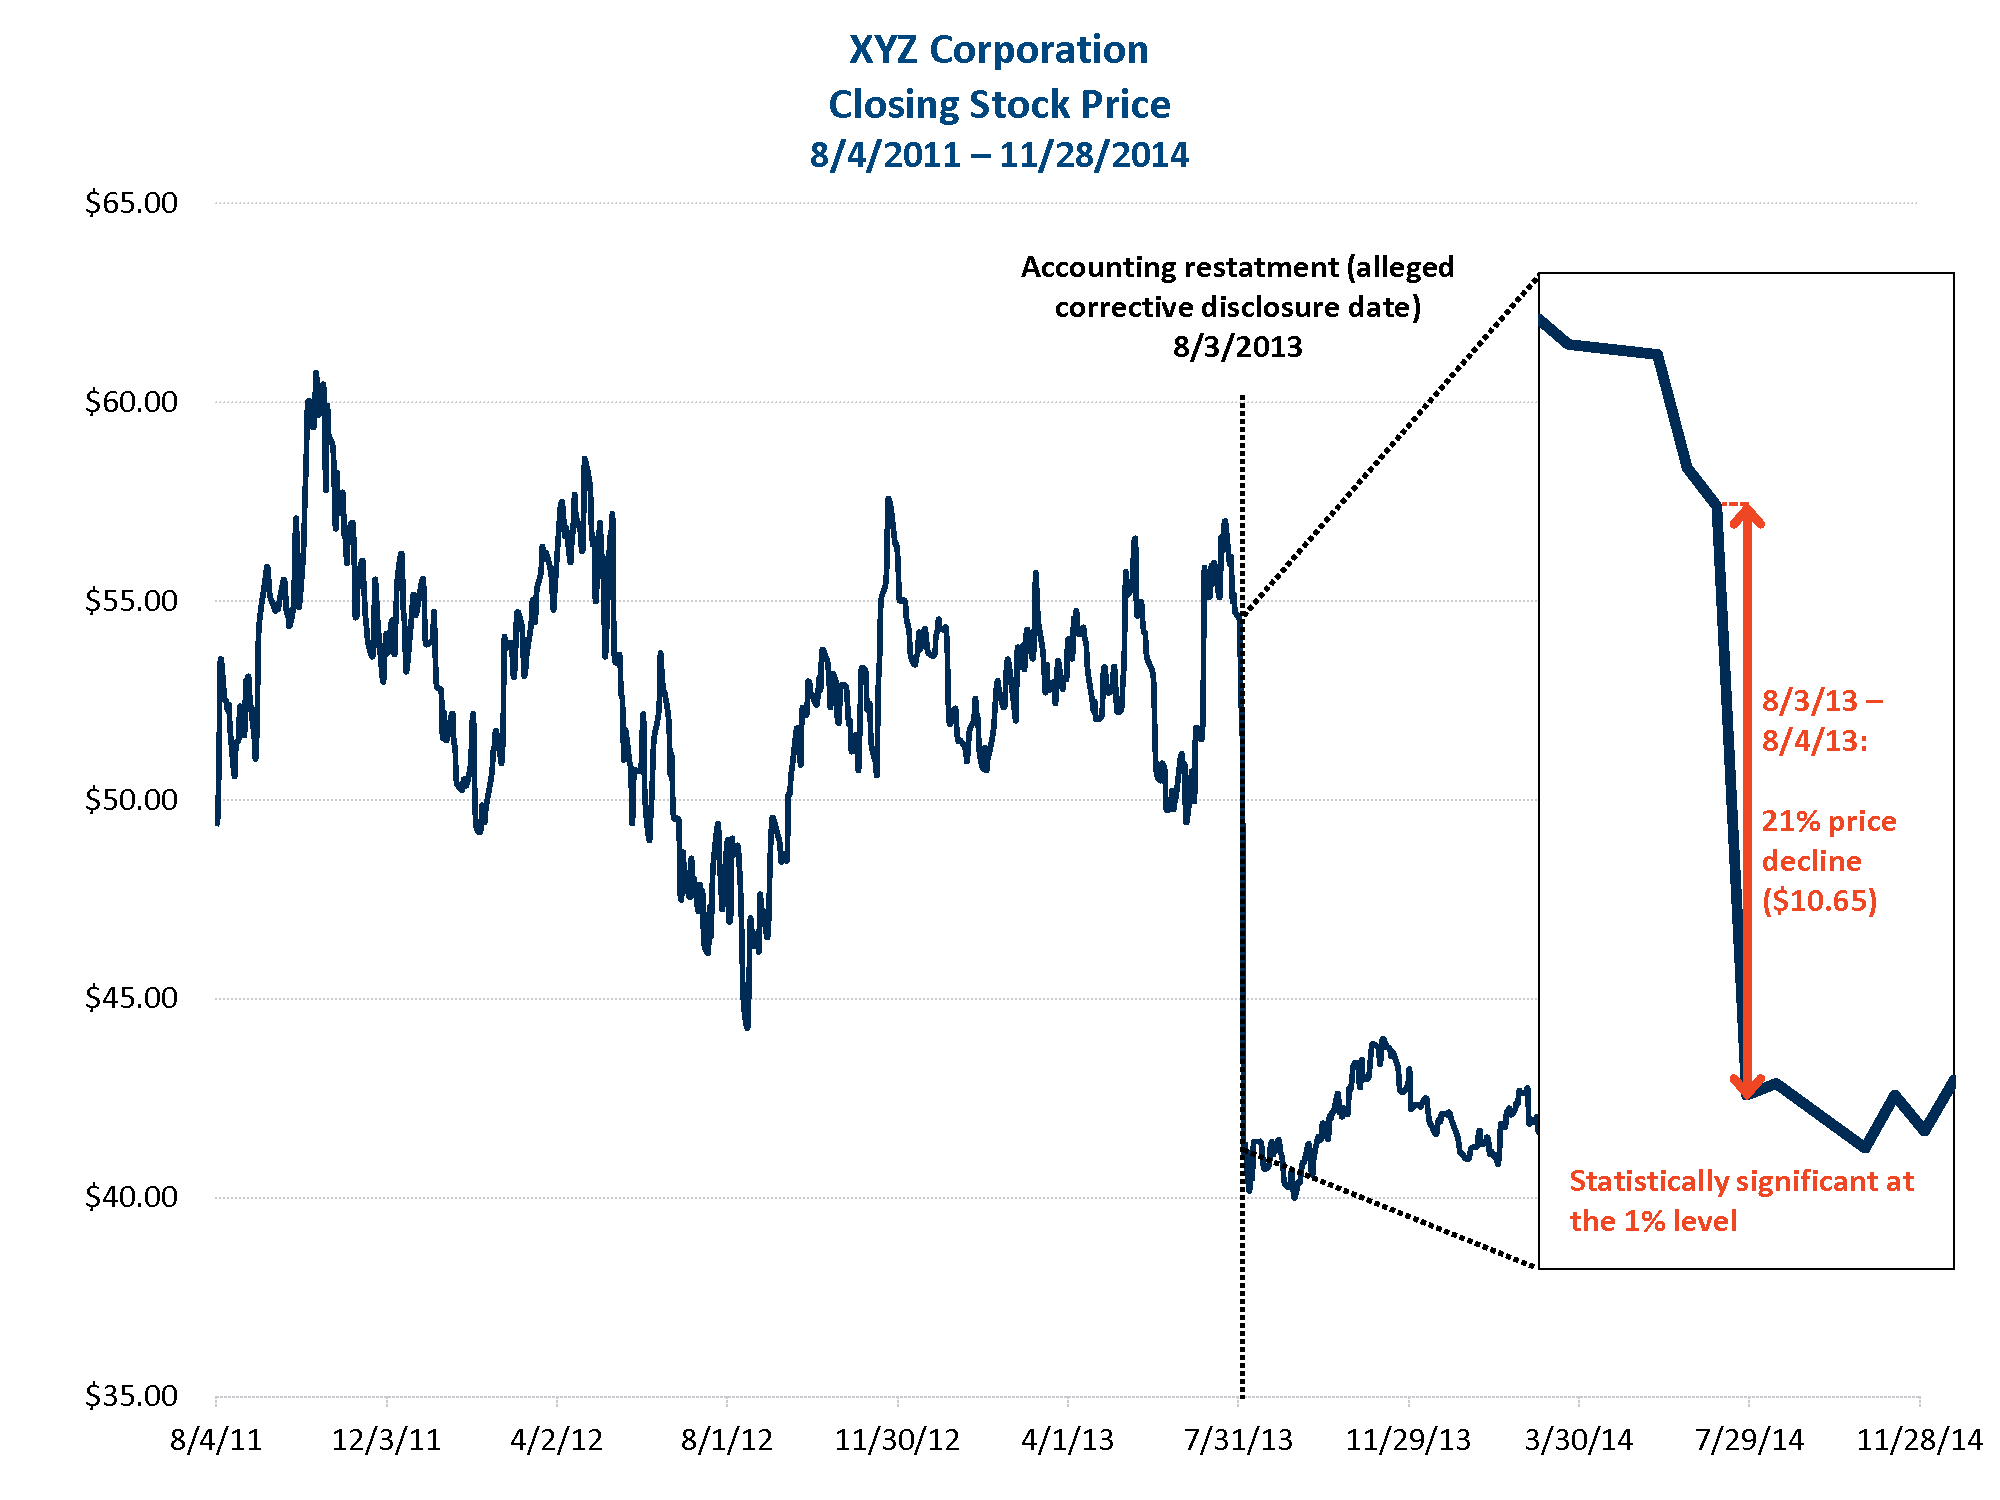
Figure 1
Estimation of residual returns. On August 3, 2013, XYZ's actual negative daily stock return of 21% is comprised of its expected return (the sum of the return associated with market and industry movements) and the residual, company-specific return. The latter is equal to -12% and is statistically significant at the 1% level.
One can further decompose this company-specific return of -12% into the portion resulting from fraud-related information (-5.5%). For example, suppose the alleged corrective disclosure was a correction in XYZ's actual earnings per share. The fraud-related component of that disclosure is just the earnings surprise conveyed to the market: the difference between the new corrected earnings per share and the market's previous expectations, rather than the new earnings level. One could disentangle the fraud-related surprise using an earnings-response-coefficient model, which determines the impact of earnings surprises on residual stock returns. If this fraud-related portion is also statistically significant, the release of the fraud-related information (the earnings correction) had a material impact on the stock price.
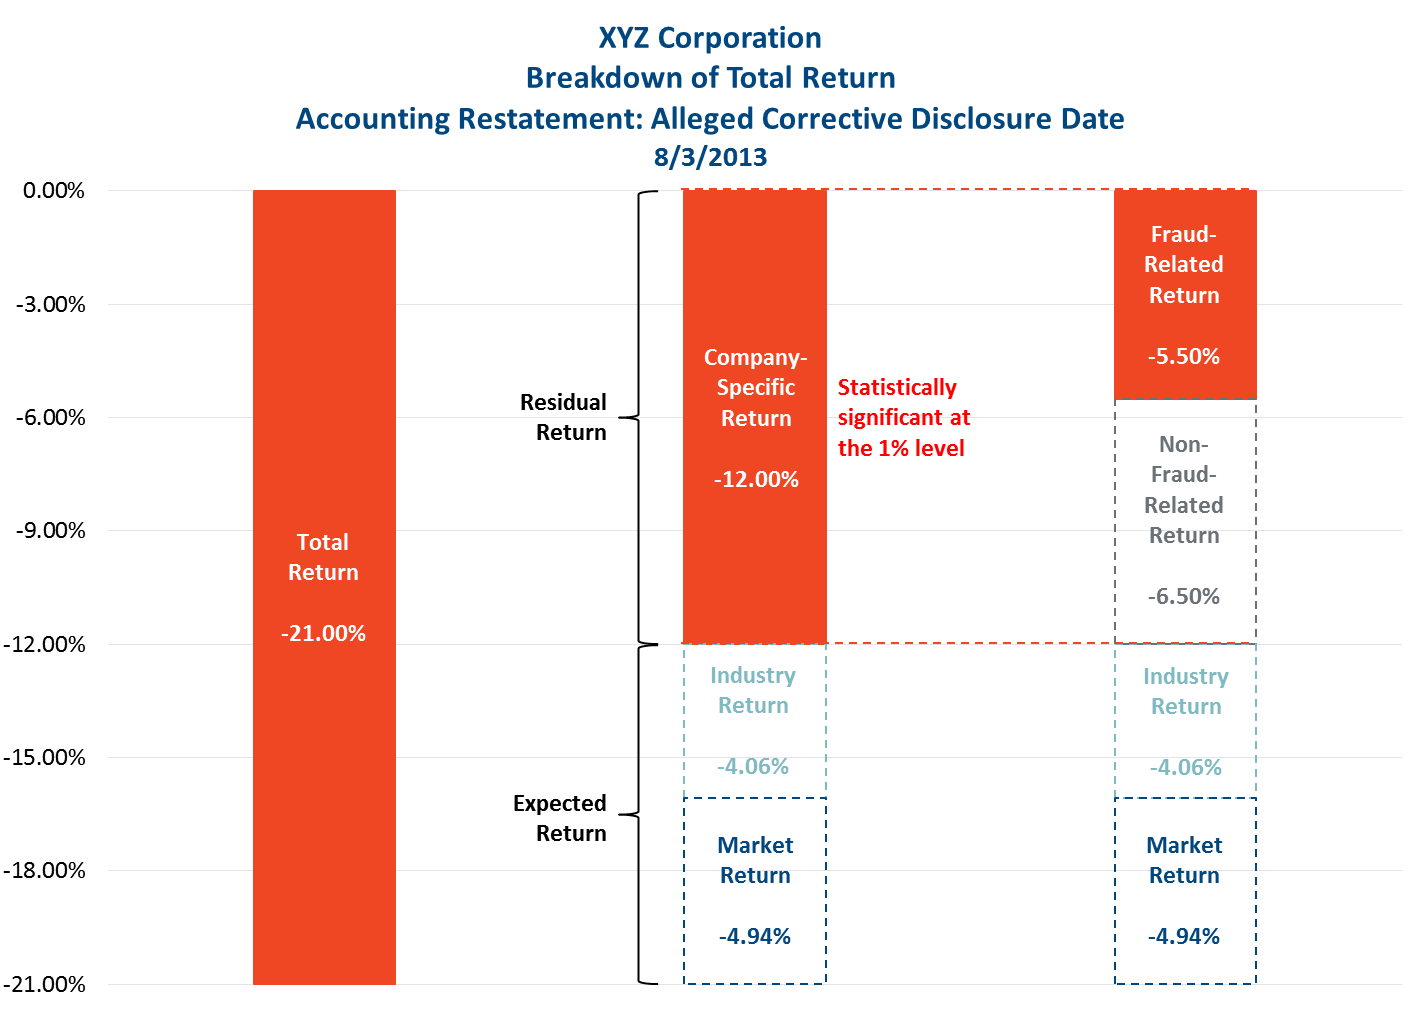
Figure 2
Intraday confounding. The chart below displays two intraday events on August 3, 2013. The first, just after 11:21 a.m., corresponds to the exact time of XYZ's alleged corrective disclosure and produces a total stock price drop of 1.31% (using 1-minute returns). Of this -1.31% return, -0.64% is the residual company-specific return for XYZ, and it is not statistically significant using 1-minute, 5-minute, or 15-minute returns. Yet the company-specific residual for the whole day (-12%) is significant at the 1% level. The discrepancy is driven by other non-fraud-related disclosures on the same day.
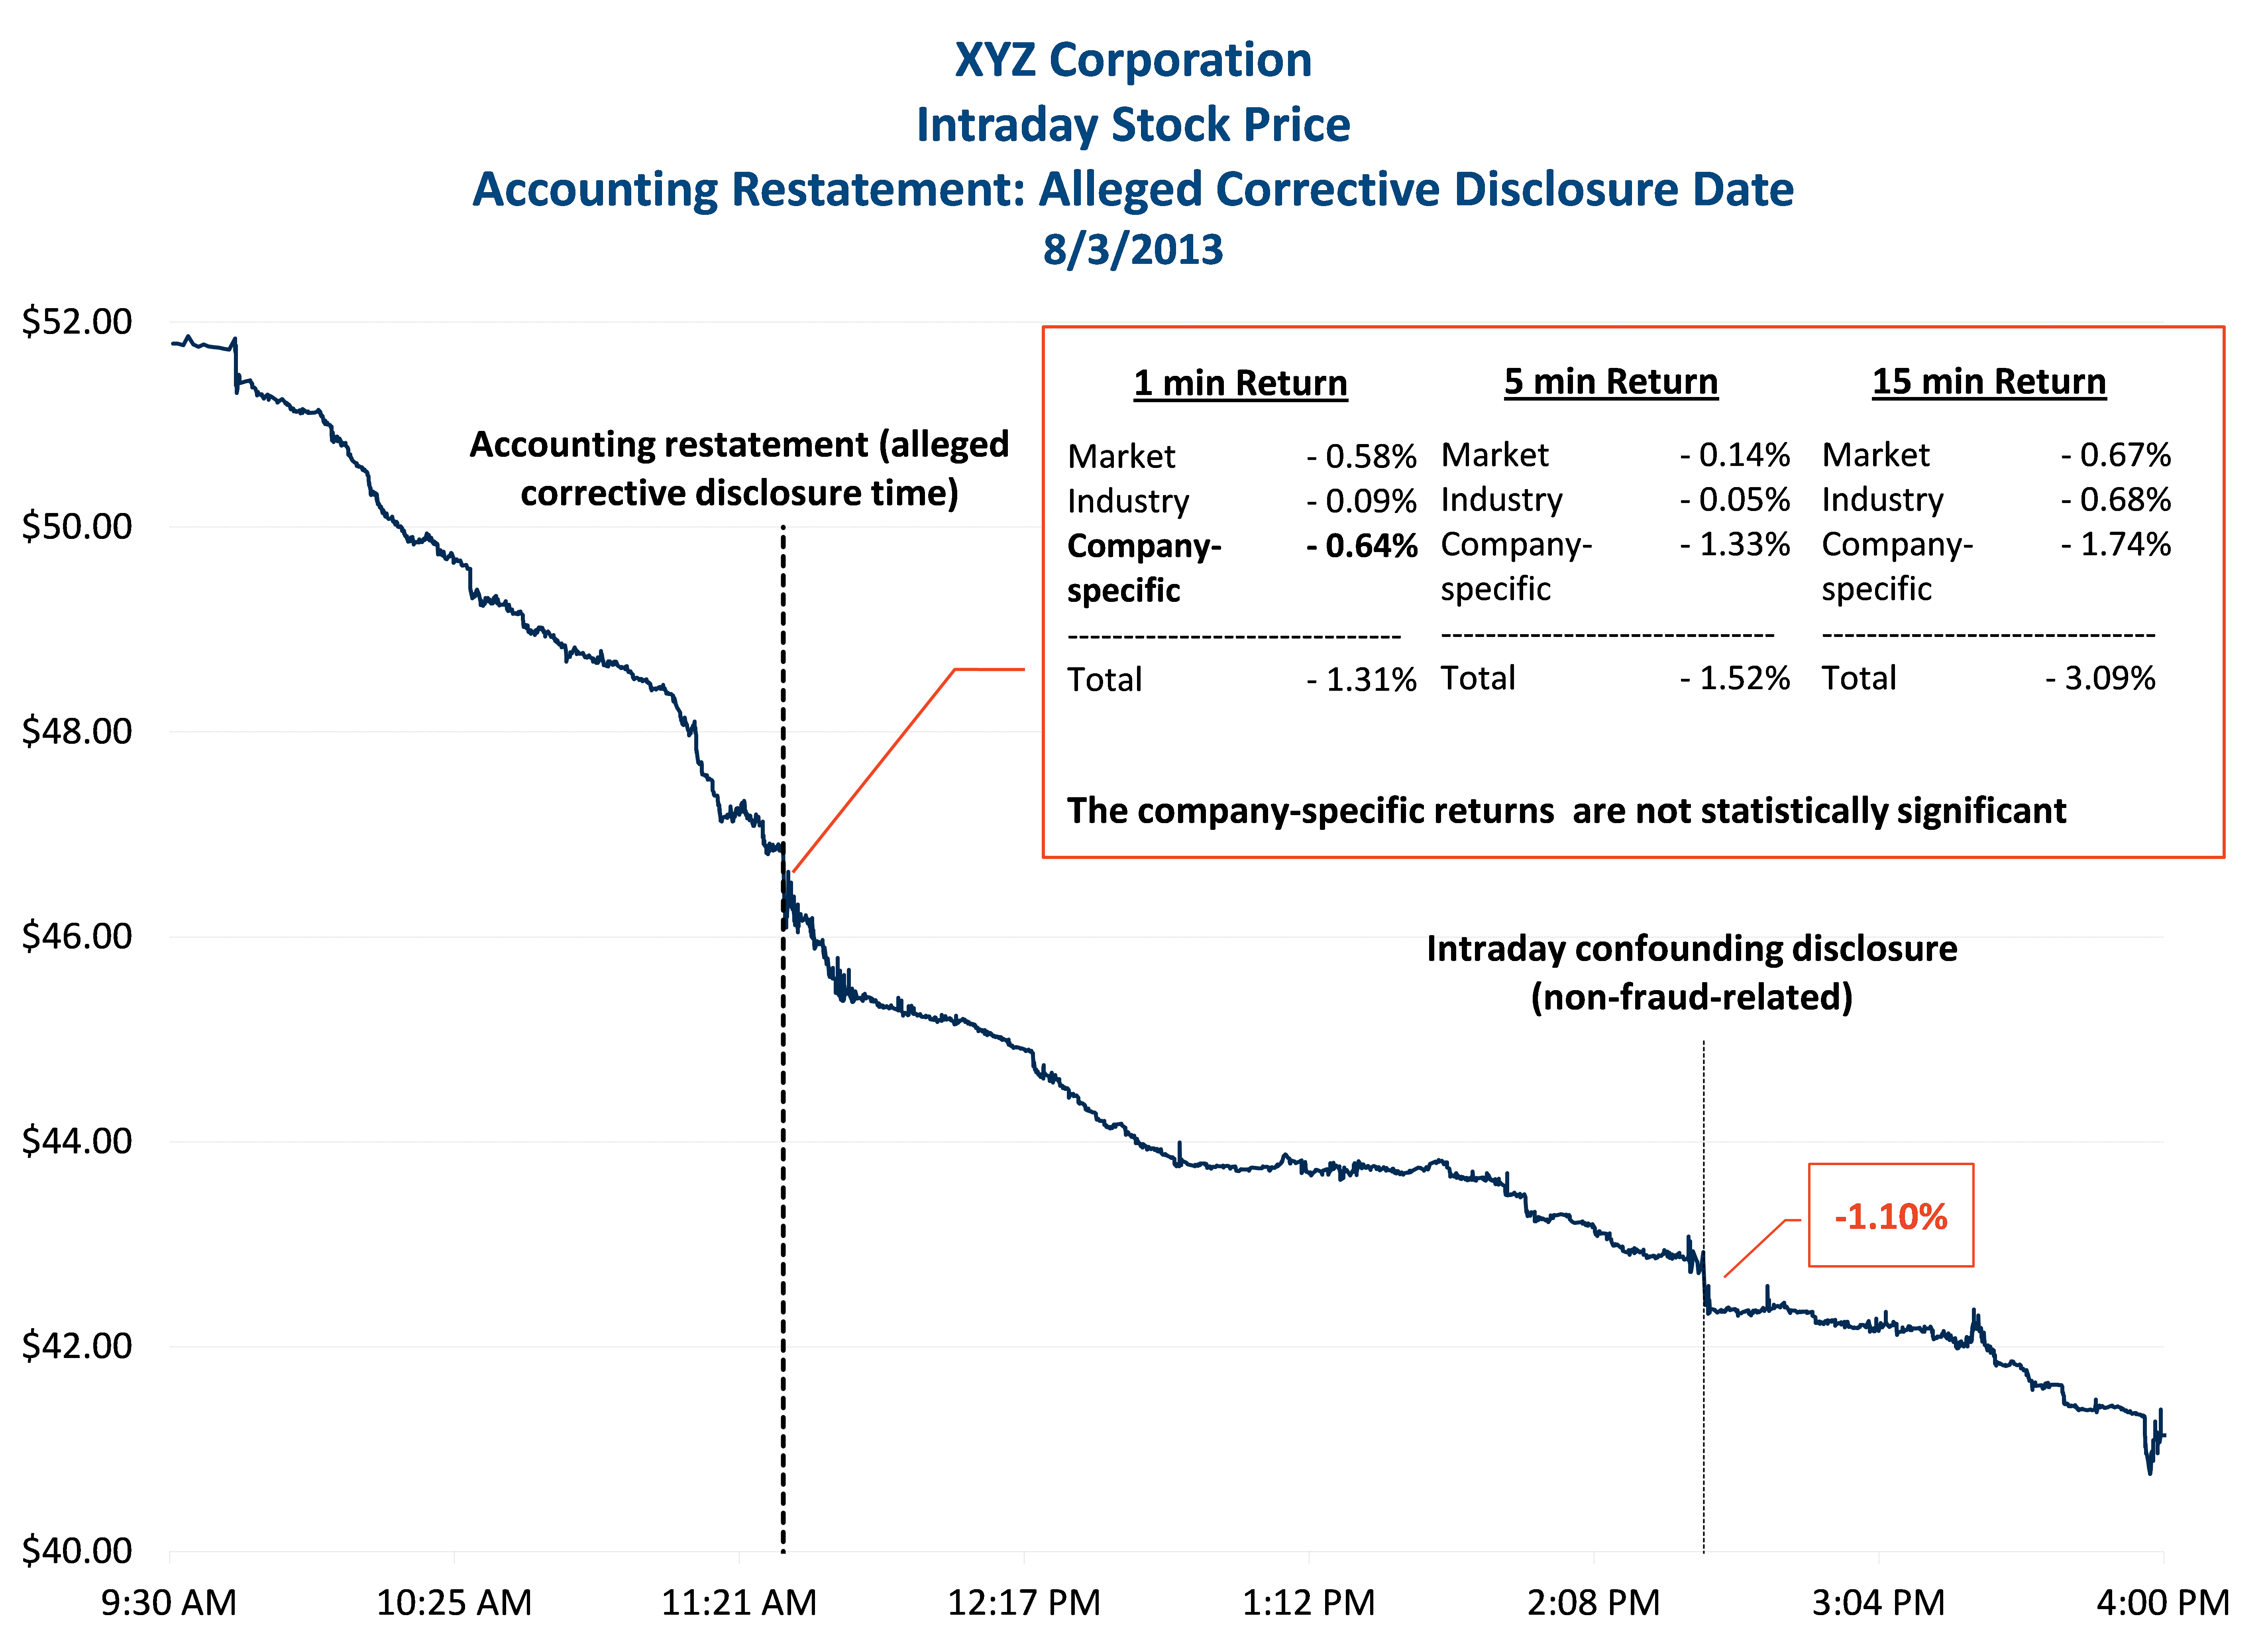
Figure 3
The second intraday event, between 2 and 3 p.m., produced a further drop of just over 1% that was unrelated to the earlier alleged corrective disclosure. Disentangling this second confounder is necessary to isolate the portion of XYZ's price movement resulting only from the disclosure of interest (the -0.64% drop using 1-minute returns). Examining daily returns alone, one would falsely conclude that XYZ's residual return was significant and that the alleged corrective disclosure had a material price impact. Zooming in to the exact time of the disclosure reaches the opposite conclusion. This is the single-firm confounding problem in concrete form: in a multi-firm study the second-event noise would average away, but in one firm on one day it does not, and only the intraday decomposition (or an ERC adjustment) recovers the fraud-related signal.
Run it with our tools
The applications on this site implement the litigation workflow end to end:
Abnormal Return Calculator (ARC) is the core instrument for this use case. Supply an event file keyed to the corrective-disclosure date, set an estimation window of roughly 120 to 250 days ending before the event and a short event window (the event day, or [-1,+1] / [0,+1]), choose an expected-return model that includes market and industry factors (Market Model, CAPM, Fama-French 3- or 5-factor, Carhart 4-factor), and run the parametric and non-parametric significance tests. Read the abnormal return, the t-statistic, and the empirical (distribution-free) critical value built from the estimation-window residuals, then net out a same-day confounder before treating the residual as fraud-related.
Event Date Identifier (EDI) pins down the exact disclosure timestamp (8-K, press release, analyst note), the prerequisite for credible same-day confounder analysis and for any intraday study.
Abnormal Volatility Calculator (AVyC) addresses the volatility-change problem directly: it lets you model period-specific or conditional volatility so the event-window critical value is not understated during crisis or earnings-season turbulence, the Type I inflation flagged by Baker (2016).
Abnormal Volume Calculator (AVC) corroborates that information actually arrived on the event date, a useful cross-check when the directional price effect is ambiguous or contested.
News Analytics (CATA) helps build the news flow for confounding analysis: identify and classify other firm-specific disclosures on the event day so the fraud-related component can be separated from contemporaneous, unrelated news.
Related use cases
Litigation studies share design questions with the corporate-event applications and with the disclosure-timing problems of earnings work. See the closely related Earnings Announcements page (the ERC decomposition and same-day confounding recur there), and the corporate-event pages on Mergers and Acquisitions and Divestitures, where price impact and confounding are also central. For the methodological foundations, see Academic Research. For the full catalogue, return to the Practical Applications overview.
References
- Baker, A. C. 2016. "Single-firm event studies, securities fraud, and financial crisis: Problems of inference." Stanford Law Review, 68(5): 1207-1262. stanfordlawreview.org
- Brav, A., and J. B. Heaton. 2015. "Event studies in securities litigation: Low power, confounding effects, and bias." Washington University Law Review, 93(2): 583-614. openscholarship.wustl.edu
- Cornerstone Research. 2024. Securities Class Action Settlements: 2024 Review and Analysis. Cornerstone Research. cornerstone.com
- Dunbar, F. C., and A. Heller. 2006. "Fundamentals of damages in securities fraud litigation." In R. L. Weil, P. B. Frank, C. W. Hughes, and M. J. Wagner (eds.), Litigation Services Handbook: The Role of the Financial Expert. New York: Wiley.
- Fisch, J. E., and J. B. Gelbach. 2021. "Power and statistical significance in securities fraud litigation." Harvard Business Law Review, 11(1): 55-111. journals.law.harvard.edu
- Fisch, J. E., J. B. Gelbach, and J. Klick. 2018. "The logic and limits of event studies in securities fraud litigation." Texas Law Review, 96(3): 553-618. texaslawreview.org
- Gelbach, J. B., E. Helland, and J. Klick. 2013. "Valid inference in single-firm, single-event studies." American Law and Economics Review, 15(2): 495-541. https://doi.org/10.1093/aler/aht011
- Mitchell, M. L., and J. M. Netter. 1994. "The role of financial economics in securities fraud cases: Applications at the Securities and Exchange Commission." The Business Lawyer, 49(2): 545-590. jstor.org
- Tabak, D. I., and F. C. Dunbar. 1999. "Materiality and magnitude: Event studies in the courtroom." NERA Working Paper (reprinted in Litigation Services Handbook). ssrn.com
Cases cited
- Basic Inc. v. Levinson, 485 U.S. 224 (1988).
- Dura Pharmaceuticals, Inc. v. Broudo, 544 U.S. 336 (2005).
- Comcast Corp. v. Behrend, 569 U.S. 27 (2013).
- Halliburton Co. v. Erica P. John Fund, Inc., 573 U.S. 258 (2014) (Halliburton II).
- Goldman Sachs Group, Inc. v. Arkansas Teacher Retirement System, 594 U.S. 113 (2021).
- In re Vivendi, S.A. Securities Litigation, 838 F.3d 223 (2d Cir. 2016).
- Bricklayers and Trowel Trades Int'l Pension Fund v. Credit Suisse First Boston, 853 F. Supp. 2d 181 (D. Mass. 2012).
- In re Novatel Wireless Securities Litigation, 910 F. Supp. 2d 1209 (S.D. Cal. 2012).
See the full bibliography for all sources cited across the site.