In short: this page is a practical guide to writing up an event study as a case study or research paper, from framing the event and choosing windows and models to reporting abnormal returns and significance tests. Run the analysis free in ARC.
Writing case studies backed by quantified market reaction and news sentiment
A great teaching or business case turns a real event into a story: a protagonist, a dilemma, a decision, and a consequence. Event-study methodology lets you make the consequence empirical. By measuring the abnormal return (the part of a stock's move that the market itself did not predict) around a firm's competitive action, product recall, merger, or crisis, you attach a precise, defensible number to "how the capital market judged this decision." Paired with computer-aided text analysis (CATA, our News Analytics app) of the surrounding news flow, you can also quantify the sentiment of the coverage and reconstruct the chronicle of strategic change that the case narrates.
This page is a step-by-step approach for educators and students: how to convert a single real event into a rigorous case study that is backed by both a quantified market reaction (abnormal returns and volume) and a quantified news signal (sentiment and coded competitive actions). It combines the case-method research tradition (Eisenhardt, 1989; Jauch, Osborn & Martin, 1980) with the finance event-study canon (Fama, Fisher, Jensen & Roll, 1969; MacKinlay, 1997; Brown & Warner, 1985) and the textual-analysis literature (Tetlock, 2007; Loughran & McDonald, 2011).
The method has a clear origin point. The abnormal-return technique this page relies on was introduced by Fama, Fisher, Jensen & Roll (1969), who studied 940 stock splits between 1927 and 1959 with the market model on monthly CRSP data and showed that cumulative average residuals rise in the roughly 29 months before a split (the split proxies for an anticipated dividend increase) and are essentially flat afterward. That was the first event study and the first direct test of semi-strong market efficiency, and every benchmark below descends from it.
The intuition: an abnormal return is a surprise-adjusted scorecard
Before any formula, the intuition. An abnormal return is the market's surprise-adjusted scorecard for a single firm on a single day. It strips out the move the whole market would have made anyway (the part driven by the index, the sector, the macro tape), so what is left is the slice of the price move attributable to this firm's event. The cumulative abnormal return (CAR) simply adds that scorecard across the days the news was being digested. Price and volume answer two different questions: the price reaction says how the market re-rated the firm's value, while the volume reaction (and, for crises, the volatility reaction) says how strongly investors actually traded on it, confirming that information genuinely arrived rather than the price drifting on noise.
EventStudyTools' research apps help you overcome two critical empirical challenges in writing case studies:
- Our News Analytics research apps help you to accurately map the competitive actions of firms over extended periods of time and thus create the chronicle of strategic change you may want to study (Chakravarthy & White, 2001).
- Our event-study research apps help you to quantify stock-market responses to firms' competitive actions or market shocks, which lets you add the capital-market perspective to your case study.
The News Analytics research apps were designed with the analysis of press releases in mind. Consider press releases as a source of empirical data for your case-study research. They have several advantages:
- You receive a longitudinal dataset that typically stretches across many years.
- Given strong reporting regulations in many countries, press releases provide granular coverage of the studied companies' change efforts and other impactful events.
One caveat to teach from the start: press releases are firm-authored and skew positive and strategic. To measure events rather than corporate spin, triangulate them with independent wire or news coverage (via a news aggregator) and document your coverage source explicitly.
To sum up, for case-study writing, EventStudyTools' research apps give you access to computational methods (e.g. text analysis) and techniques (e.g. regular expressions) that can be combined with newly arising technological opportunities (e.g. web scraping of press releases) in an innovative form of longitudinal organizational change research (Van de Ven, Polley, Garud, & Venkataraman, 1999; Van de Ven & Poole, 1995). And unlike license-gated SAS/WRDS incumbents that ship only software manuals, every calculator here is free and browser-based, so a student or analyst can replicate a named real case end to end in an afternoon with no SAS license.
This empirical strategy allows for large samples of individual firm cases covering resource-allocation decisions, competitive actions, and governmental changes (Eisenhardt, 1989; see the website's section on competitive dynamics research for more details on firms' action sequences). Additionally, the website's Abnormal Return Calculator lets you include stock-market responses to firms' competitive actions in your research.
What the research shows
If you are going to teach students that "the market reacted," you should be able to tell them what a reaction typically looks like: its sign, its size, and how long it lasts. The empirical literature gives clear, citable benchmarks. They are most useful as a sanity check: if your measured CAR is far outside the range below, suspect a confounding event, a misdated announcement, or a model or data error before you write up a record-breaking result.
Benchmark magnitudes (with exact figures)
| Event type | Typical abnormal return (sign, size, window) | Source |
|---|---|---|
| News tone (market level) | -8.1 bp the next trading day per one-standard-deviation rise in media pessimism, reversed (+6.8 bp) over lags 2 to 5; five-lag sum -1.3 bp (not significant), i.e. full reversion in about four trading days | Tetlock (2007) |
| M&A, target firm | +16.0% over [-1,+1] (large, robust across decades) | Andrade, Mitchell & Stafford (2001) |
| M&A, acquirer firm | -0.7% over [-1,+1] (indistinguishable from zero 1973 to 1998; see "have these held up?" below for the post-2009 flip) | Andrade, Mitchell & Stafford (2001) |
| M&A, combined | +1.8% over [-1,+1] (significantly positive; about 2% of merged value, roughly 10% of the target's pre-deal value) | Andrade, Mitchell & Stafford (2001) |
| Earnings (PEAD) | about +2% drift over 60 trading days for the extreme good-news SUE decile; about +4.2% per quarter (roughly 18% annualized) for the long-short SUE strategy; persists 2 to 3 quarters | Bernard & Thomas (1989) |
| Data breach | mean CAR about -0.3% to -1.1%; severe breaches (financial or personal data, confirmed-impact ransomware) about -3% to -5%; SEC Item 1.05 disclosures average about -3% | Acquisti, Friedman & Telang (2006); cyber event-study literature |
| Product recall | mean about -0.5%; severe high-hazard recalls much larger (Toyota 2010 accelerator recall about -15%); rivals often earn positive abnormal returns (spillover) | Recall event-study literature; Jacobs & Singhal (2020) |
| S&P 500 index addition | historically about +4% to +6%; decayed to near zero in the most recent decade (see below) | Greenwood & Sammon (2023) |
News tone moves prices, but the effect is small and short-lived
Tetlock (2007), which won the Smith-Breeden Prize, provided the first robust evidence that the content of the news media predicts market moves. Using daily pessimism from the Wall Street Journal "Abreast of the Market" column (scored with the Harvard-IV General Inquirer dictionary), a one-standard-deviation increase in media pessimism predicts an 8.1-basis-point decline in the Dow the next trading day, followed by a 6.8 bp reversal over lags 2 to 5; the sum of all five lag coefficients is -1.3 bp, statistically indistinguishable from zero, meaning the move fully reverts within about four trading days. Unusually high or low pessimism also predicts elevated trading volume. The pattern fits temporary noise-trader or liquidity pressure, not new fundamental information.
Do not confuse this with its firm-level cousin. Tetlock, Saar-Tsechansky & Macskassy (2008) showed that at the individual-firm level, the fraction of negative words in firm-specific news forecasts lower next-quarter earnings, prices briefly underreact and then incorporate that information, and predictability is strongest for stories explicitly about fundamentals. The two-sentence contrast students must internalize: Tetlock 2007 is market-level noise-trader pressure that fully reverses (do not over-read it as tradable); Tetlock-Saar-Tsechansky-Macskassy 2008 is a firm-level fundamentals signal that gets priced in and stays. The lesson for case writers: tone is a real but noisy, short-horizon signal; keep event windows tight and do not over-read long-horizon sentiment effects.
Typical magnitudes students can expect
- Mergers and acquisitions: the modern teaching benchmark is Andrade, Mitchell & Stafford (2001): three-day [-1,+1] announcement CARs of +16.0% (target), -0.7% (acquirer, indistinguishable from zero), and +1.8% (combined, significantly positive) over their 1973 to 1998 CRSP sample. The combined value gain of about 2% of the merged entity equals roughly 10% of the target's pre-deal value, the empirical hook for the classic "value created vs. overpaid" debate. Keep the announcement-window CAR distinct from the takeover premium (the price offered above the pre-bid trading price, often around 30% in tender offers): the CAR is the market's reaction, the premium is the deal's headline price. Target CARs and premiums are stable across decades; acquirer returns are regime-dependent (see below).
- Earnings announcements: post-earnings-announcement drift (PEAD), the "granddaddy of underreaction events," shows about +2% cumulative abnormal return over 60 trading days for the extreme good-news SUE decile and roughly +4.2% per quarter for a long-short SUE strategy (Bernard & Thomas, 1989), persisting 2 to 3 quarters. Treat the magnitude as contested in recent samples and dependent on how the earnings surprise is measured: it is weak by traditional SUE (Martineau, 2022; Chordia, Subrahmanyam & Tong, 2014) but strong for 2008 to 2019 using a text-based surprise (Meursault et al., 2023). PEAD itself is a lesson that an anomaly's apparent decay can be a measurement artifact.
- News tone (market level): -8.1 bp the next day per one-standard-deviation pessimism shock, reverting within about four trading days (Tetlock, 2007).
Have these magnitudes held up? Date-stamp every benchmark
This is the single habit that separates a rigorous case from a stale one: a documented market reaction is not a constant of nature, it is a measurement from a particular sample period, and several have decayed or flipped since they were first published. A case written today should not assume a 2005 magnitude still applies.
- Acquirer returns flipped positive. The classically flat-to-negative acquirer reaction is a 1990 to 2009 fact. After the 2008 crisis, average acquirer announcement abnormal returns turned positive: -1.08% (1990 to 2009) versus +1.05% (2010 to 2015), and +2.54% for mega-deals, with stock-for-stock deals "no longer destroying value" (Alexandridis, Antypas & Travlos, 2017). This is the cleanest classroom example that an event-study magnitude can flip with the sample period and the governance regime.
- The index-addition effect decayed to near zero. The S&P 500 addition abnormal return fell from about 7.6% in the 1990s to about 0.8% in the most recent decade, with the median addition excess return dropping from 8.32% (1995 to 1999) to roughly -0.04% (2011 to 2021), as arbitrage, ETF growth, and index-fund front-running competed it away (Greenwood & Sammon, 2023; Patel & Welch, 2017; Bennett et al., 2020).
- Anomalies decay generally. Across 97 published cross-sectional predictors, returns are 26% lower out-of-sample and 58% lower post-publication (McLean & Pontiff, 2016): documented reactions shrink once they are widely known.
- Even LLM sentiment signals decay. A GPT-based long-short news-sentiment strategy saw its annualized Sharpe ratio fall from 6.5 (late 2021) to about 1.2 (early 2024) as adoption rose (Lopez-Lira & Tang, 2023), a vivid modern echo of the same lesson.
Practical instruction for case writers: report the calendar window of any benchmark you cite, and where possible re-estimate the reaction on a recent sub-sample rather than quoting a decades-old figure.
Which magnitudes are stable, which are fragile?
- Stable: target-firm M&A premiums and CARs; the short-window daily event-study test specification itself (Brown & Warner, 1985); the abnormal-return machinery (MacKinlay, 1997).
- Fragile / decayed: acquirer returns (regime-dependent); the index-addition effect (decayed); cross-sectional anomalies generally (McLean & Pontiff, 2016); sentiment-trading Sharpe ratios (decay with adoption).
Cross-sectional drivers and the sign convention
The size of a market reaction is not uniform. Positive or optimistic news content is associated with positive abnormal returns and negative or pessimistic content with negative abnormal returns, but news volume (attention) is often a stronger signal than news tone, and tone matters most for smaller, lower-visibility firms. Drivers of reaction size therefore include firm visibility and coverage, firm size, and whether the news concerns fundamentals or sentiment. Markets are also anticipatory: nonzero abnormal returns before the nominal event date signal leakage or anticipation, while returns after the date measure the event's impact, a pre/post pattern that is itself a teachable narrative beat.
Dictionary choice changes the answer
A foundational result for the CATA step: Loughran & McDonald (2011) showed that general-purpose word lists are wrong for finance. Almost three-quarters (about 73.8%) of the words flagged as negative by the Harvard-IV dictionary in 1994 to 2008 10-Ks are not negative in a financial context, for example "tax," "cost," "capital," "liability," "board," "vice," and "foreign." Their finance-specific sentiment word lists are now the field standard and link more cleanly to filing-period returns, volume, volatility, fraud, material weakness, and unexpected earnings. Their 2016 survey is the natural best-practice citation for a teaching page: because textual analysis is far less precise than quantitative methods, "understanding the art is of equal importance to understanding the science" (Loughran & McDonald, 2016).
The LLM era: a modern successor to Tetlock
Large language models are now a third way to score tone, alongside keyword and dictionary methods. Lopez-Lira & Tang (2023) show that GPT sentiment scores from news headlines predict next-day returns with no finance-specific training, the contemporary successor to Tetlock (2007). But, reinforcing rather than overturning the "tone is noisy and short-lived" lesson, the strategy's Sharpe ratio decayed from 6.5 to about 1.2 in roughly two years as the signal was adopted. For a teaching case, dictionary methods remain the transparent, validatable, reproducible choice; LLM scoring is a powerful but opaque complement, not a replacement.
Coded competitive actions as the unit of analysis
The page's own intellectual lineage is the competitive-dynamics tradition, where the relevant "events" are coded competitive actions (price moves, product launches, capacity changes, legal actions). Chen, Smith & Grimm (1992) established structured coding of competitive actions and responses from public news as the right unit of analysis, and Ferrier (2001) is the exemplar of turning press coverage into a longitudinal, coded "chronicle of strategic change," exactly the CATA workflow this page describes. Action characteristics such as radicality, irreversibility, and visibility predict the speed and magnitude of rival response and the associated wealth effects.
How to run this kind of event study
The empirical workflow has four steps. Figure 1 illustrates them; the paragraphs below give the methodological specifics, and the warnings that follow are where students most often go wrong. For the underlying mechanics, see our introduction to event-study methodology (concept) and the event-study application blueprint (step-by-step how-to). Sorescu, Warren & Ertekin (2017) is the best-practice review aimed at exactly this page's non-finance audience: use a clean pre-event estimation window, keep the event window short and theory-justified, screen every event for confounds, and report nonparametric tests alongside parametric ones.
Figure 1: Empirical Challenges of Writing Case Studies that Use News Analytics
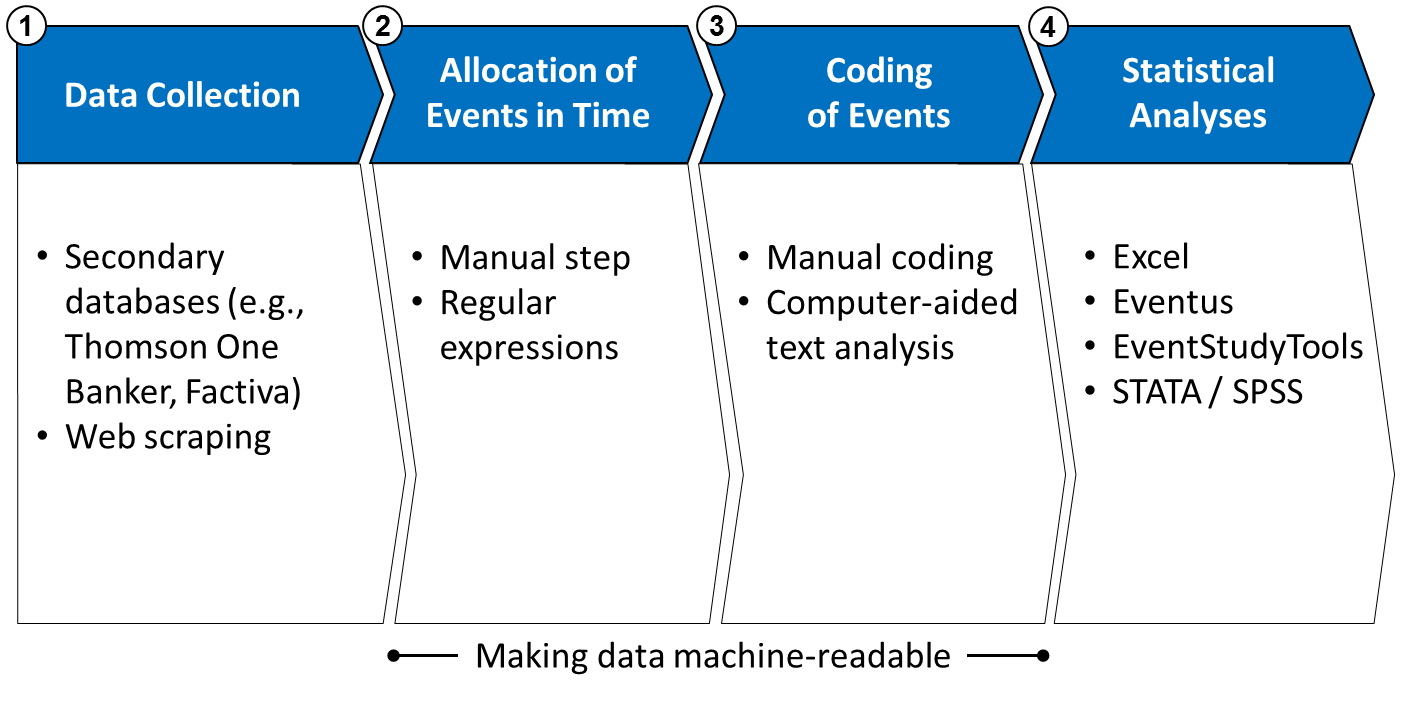
(1) Data Collection: Case studies tell a story about the organizational behavior of firms, and there are different ways to document that behavior. You may manually capture a firm's competitive actions through traditional means such as expert interviews. Alternatively, you can scrape the organization's press releases and identify the respective competitive actions using computer-aided text analysis. This automated approach is rapidly gaining popularity because it allows for larger samples. If you want to retrieve news from sources other than the firms' own websites, use a news aggregator that consolidates sources, which also helps you avoid measuring corporate spin rather than independent reporting.
(2) Allocation of Events in Time: Writing case studies that use news analytics requires you to allocate individual news items in time. This can be done by hand for a small sample, but larger samples call for an automated approach. The website's regular-expression-based Event Date Identifier (EDI) is capable of processing large volumes of press releases and hands you back all dates mentioned within the release texts.
Pinning the event date: operational rules
The date is a measurement, not a given, and getting it wrong is one of the most common ways a case quietly fails. Concrete rules:
- After-close or non-trading-day news: use t+1. If an announcement is released after the market closes (or on a weekend or holiday), the price reaction is captured on the next trading day, so the event date should be t+1, not the press-release dateline.
- Mind the Monday/weekend effect. Friday-evening and weekend news lands on Monday's open; treat the timing explicitly rather than anchoring to the dateline.
- Use the earliest wire timestamp, not the dateline. The relevant date is when information first reached the market (the earliest news-wire timestamp), not the firm-authored press-release dateline, which skews positive.
- Misdating biases CAR toward zero (attenuation). A mis-anchored or leaked event date smears the reaction across days outside your window, so a null result can be a dating artifact rather than a true non-reaction. Always reconcile multiple dates per document before trusting a zero CAR.
(3) Coding of Events: For an automated solution, use the website's keyword-based News Analytics (CATA) app to classify action types and assign sentiment. Keyword and dictionary coding must be validated, not assumed. Ground your dictionary in a priori theory, assess its dimensionality, generate an exhaustive word list, and establish content and convergent validity against human coding (Short, Broberg, Cogliser & Brigham, 2010; McKenny, Aguinis, Short & Anglin, 2018). Use a finance-specific lexicon rather than a general one (Loughran & McDonald, 2011), and check that high-frequency words are not dominating the count (Zipf's law).
(4) Statistical Analysis: Your choice of analysis tool should be informed by your research question. To assume the capital-market perspective on the firm's strategic decisions, draw on the website's Abnormal Return Calculator. The abnormal return is the actual return minus the expected (normal) return, aggregated over the event window into a cumulative abnormal return (CAR) and tested for significance (MacKinlay, 1997).
Window choice and the normal-return model
Estimate the normal-return model over a clean estimation window (commonly about 120 to 250 trading days ending before the event window) and verify that the estimation period is itself not contaminated. A market-model R-squared of only about 20% to 40% for an individual stock is entirely normal (Campbell, Lo & MacKinlay, 1997), so do not mistake a low estimation-window fit for a broken model. Then measure the reaction over a short, theory-justified event window, for example [-1,+1] or [0,+1] for the clean information-content estimate, optionally adding a longer post-event window to document drift or underreaction. Widening the window trades statistical power for contamination risk (Brown & Warner, 1985; McWilliams & Siegel, 1997). Motivate your model choice rather than defaulting to it: our ARC app offers the constant-mean, market, market-adjusted, CAPM, Fama-French three-factor, Carhart four-factor, and Fama-French five-factor models.
The long-horizon caveat: the bad-model problem
Long-horizon (multi-month or multi-year) abnormal-return estimates are fragile. Fama (1998) calls this the bad-model problem: reasonable changes in the benchmark expected-return model can make apparent long-run abnormal performance appear or disappear. The recognized partial remedies are buy-and-hold abnormal returns (BHAR) and calendar-time portfolio approaches (Barber & Lyon, 1997; Lyon, Barber & Tsai, 1999). For defensible inference, teaching cases should stay on short windows; reserve long-horizon claims for the discussion section, clearly flagged as model-dependent. This is the formal backing for "do not over-read long-horizon sentiment."
Confounding events: the number-one teaching pitfall
The single most important lesson is that the event must be the only relevant change in the window, otherwise you commit the "rooster crows, then the sun rises" causal fallacy. McWilliams & Siegel (1997) operationalize confound control as a checklist: before attributing a CAR to the studied event, hand-screen the (typically two-day) event window for each of these, and drop or flag contaminated firms:
- dividend announcements or changes
- earnings announcements
- executive (CEO/CFO) changes
- restructuring or divestiture
- other M&A activity
- joint ventures and major alliances
- major litigation or labor action
- sales or earnings guidance
- major contracts won or lost
Short windows reduce but do not eliminate contamination; confounding announcements in a short window do not have zero mean, and a contaminated estimation period (not just the event window) biases the normal-return model (Aktas, de Bodt & Cousin, 2007). Used this way, the News Analytics app doubles as a confound-detection tool, not just a coding tool. For more on inference, see our pages on significance tests and expected-return models.
Sample, the N=1 caveat, and the test-statistic ladder
A single-narrative case is N=1: report the event-window return descriptively, lean on robust nonparametric statistics, and do not over-claim statistical significance from one event. Benchmark the single firm against a peer or portfolio. Name the right tests for your design:
- N=1 / tiny samples: use the Corrado (1989) rank test and the Cowan (1992) generalized-sign test. Both are better specified under the null and more powerful than the parametric t-test for daily abnormal returns and do not assume normality or symmetry. Caveat: Corrado's rank test has known issues when applied to multi-day CARs, so prefer it for daily ARs.
- Multi-firm aggregates: use the standardized cross-sectional (BMP) test of Boehmer, Musumeci & Poulsen (1991), which corrects for event-induced variance increases; the plain Patell test over-rejects a true null when variance jumps at the event. BMP is the default parametric test in the incumbent commercial software and the right default for case-study CAR inference.
- Clustered, same-date events: use the Kolari & Pynnonen (2010) cross-correlation-adjusted statistic. With event-date clustering, even low cross-sectional correlation of abnormal returns severely over-rejects the zero-average-AR null, so a plain cross-sectional t-test is not enough.
When you aggregate many firm-cases (the "large samples of individual firm cases" described above), use cross-sectional CAR tests and cluster by event date. When linking coded sentiment to returns, separate news volume from news tone, align the sentiment measurement window to the abnormal-return window, and beware reverse causality (prices can drive subsequent coverage).
A worked example, end to end
Take a vivid, well-dated trigger such as a product recall or data breach and carry it through all four steps:
- News Analytics (CATA) codes the press-release and news stream and assigns sentiment, building the qualitative chronology of what happened and how it was framed.
- EDI pins the exact first-news date, the measurement that anchors the whole study.
- ARC computes the abnormal return and CAR over [-1,+1] and over a wider [-5,+5] window, using a market-model benchmark estimated on a clean pre-event period.
- AVC confirms a trading-volume spike, corroborating that information actually reached the market.
The ARC step is where students most need to see actual numbers, not prose. Suppose the market-model benchmark estimated on the clean pre-event period gives expected (normal) return E(R) = alpha + beta * R_market, with alpha = 0.0% and beta = 1.0 for simplicity. Over a five-day event window the firm posts the actual and expected returns below; the abnormal return each day is AR = actual minus expected, and the CAR is the running sum:
| Day | Actual return | Expected (normal) return | AR = actual - expected | Running CAR |
|---|---|---|---|---|
| -1 | +1.5% | +1.0% | +0.5% | +0.5% |
| 0 | +0.5% | +0.6% | -0.1% | +0.4% |
| +1 | +3.0% | +2.0% | +1.0% | +1.4% |
| +2 | +2.0% | +1.5% | +0.5% | +1.9% |
| +3 | +1.0% | +1.2% | -0.2% | +1.7% |
| Cumulative abnormal return (CAR) | +1.7% | +1.7% | ||
Every cell is reproducible by hand: the firm rose +1.5% on day -1 while the market model expected +1.0%, so the abnormal return is +0.5%; sum the five daily ARs (+0.5, -0.1, +1.0, +0.5, -0.2) and the cumulative abnormal return is +1.7%. A narrow [-1,+1] window here captures +1.4% of the +1.7% total, roughly 80% of the adjustment, illustrating why a tight window usually suffices. In a real study you would then run AVC to confirm a matching volume spike and apply the appropriate significance test from the ladder above.
The case narrative then weaves the sentiment timeline and the quantified market reaction into a story with a protagonist's dilemma, in the tradition of HBS or Ivey teaching cases. Archetypal crisis cases work well because the event is unambiguous, vividly narratable, and often shows competitor or industry spillover, a ready-made extension exercise. A useful "first event study" assignment is an S&P 500 index-addition lab: students sample additions, run ARC for CAR and AVC for cumulative abnormal volume, plot both, and interpret the result. Reframe its learning objective for the modern data: this is now an exercise in measuring an effect that used to be large and is now near zero, and explaining why (arbitrage, ETF growth, index-fund front-running). Otherwise students will run it, find a roughly 0% CAR, and wrongly conclude they made an error.
Copy-paste case-study deliverable rubric
Hand this to students verbatim as an assignment structure, mirroring the HBS/Ivey teaching-case format:
- Protagonist and dilemma: who faces the decision, and what is at stake.
- Background: firm, industry, and the run-up to the event.
- The event: the dated trigger, with its EDI-pinned first-news date.
- Quantified market-reaction exhibit (ARC): the AR/CAR table and the chosen window and model, with a significance test.
- Sentiment timeline (CATA): the coded tone of the surrounding coverage over time.
- Volume corroboration (AVC): evidence the information actually reached the market.
- Discussion questions: the decisions and trade-offs the numbers raise.
- Teaching note: the intended takeaways and the methodological cautions (confounds, window choice, date-stamping).
Who uses this in practice (and why it is worth real money)
Event studies are not only a classroom device. The same single-firm abnormal-return analysis is load-bearing in litigation, antitrust, cyber-disclosure, corporate IR, and regulation, which is exactly why a rigorous, confound-screened method matters in dollars. Each practitioner type maps to a calculator here:
| Who | What they do with it | EST tool |
|---|---|---|
| Securities litigators & damages experts | Prove materiality, price impact, loss causation, and damages under Rule 10b-5; the single-firm event study is now effectively the Daubert gate-keeping standard, and class-certification event studies are routine and high-stakes after Halliburton II (2014) and Goldman Sachs v. Arkansas (2021, the "inflation-maintenance" and genericness/"match" inquiry) | ARC (+ AVC corroboration) |
| Antitrust economists (FTC/DOJ) | The rival-firm event study: if a merger were anticompetitive, rivals' stocks should rise on the announcement and fall on an FTC challenge (Eckbo, 1983; Stillman, 1983; FTC working papers build on it) | ARC on rivals |
| Cyber-risk & disclosure teams | Size the market hit to a breach for SEC Item 1.05 8-K disclosures and board reporting (average disclosure CAR about -3%) | ARC + AVyC |
| Corporate IR, crisis & ESG teams | Quantify reputational damage and recovery, and distinguish announcement reaction from permanent value change | ARC + CATA |
| Regulators (OCC, OFR, FINRA) | Rulemaking impact analysis and insider-trading surveillance (FINRA screens the market for abnormal pre-announcement moves and makes hundreds of referrals a year) | ARC |
| Quant / news-analytics desks | Trade short-horizon sentiment signals (with full awareness of decay) | CATA + ARC |
This practitioner framing is also why the confound-screen and N=1 discipline above is not academic nicety: courts and damages experts require single-firm event studies that isolate firm-specific abnormal returns and screen confounders, and an opposing expert will attack exactly the window choice, model choice, and confound handling this page teaches.
Real episodes you can replicate
Each of these named, dated cases runs cleanly through the EDI then CATA then ARC then AVC pipeline. The headline number and the lesson each teaches:
- Equifax data breach (Sep 7, 2017): about -35% over the week after disclosure, roughly $5 to 6bn of market cap erased. The clean modern single-firm breach case.
- J&J Tylenol (Oct 1982): about -30% (roughly $1bn) on a product that was only about 15% of profits, but fully recovered within about two months. The overreaction lesson: a raw event-window drop mixes information with sentiment and is not the same as permanent value destruction.
- VW Dieselgate (Sep 2015): about EUR 27.4bn of abnormal equity loss in the first five days, with supplier spillover of -2.69% (Tier-1 direct-material suppliers) to -5.52% (European suppliers) the following week (Jacobs & Singhal, 2020). The spillover / run-the-event-on-the-ecosystem lesson, and the canonical ESG event study.
- BP Deepwater Horizon (Apr 2010): about -59% of market cap over 100 days, yet event studies find no statistically significant abnormal return at multi-year horizons. The window-choice lesson: short-window impact and long-horizon inference can disagree, and the bad-model problem makes the long-horizon claim fragile.
Tie this to the competitive-dynamics theme: for any scandal or recall, run the event on the competitor too. Recalls and crises frequently produce positive abnormal returns for rivals and negative returns for suppliers, which is also the FTC's actual antitrust tool (Eckbo-Stillman).
Run it with our tools
Each step of the workflow maps to one of our free calculators. Sentiment and price are complements, not substitutes: use News Analytics to build the qualitative chronology and explain why the market moved, and use ARC and AVC to quantify whether and how much it moved.
- News Analytics / Content Analysis (CATA): code the press-release and news stream, classify competitive-action types, and assign sentiment using a validated dictionary. This is the data-coding engine of the case.
- Event Date Identifier (EDI): extract and date-stamp events across large press-release corpora using regular expressions, so your event dates are precise and reproducible.
- Abnormal Return Calculator (ARC): compute abnormal returns and CARs with your choice of expected-return model (market, CAPM, FF3, Carhart-4, FF5, and more) and significance tests. This quantifies the market's verdict.
- Abnormal Volume Calculator (AVC): measure abnormal trading volume to corroborate that the information reached the market and the price move is not noise.
- Abnormal Volatility Calculator (AVyC): measure changes in return volatility around the event, useful for crises and uncertainty-driven cases.
For instructors: assign the S&P 500 index-addition lab as a first event study (ARC + AVC, framed as the anomaly-decay lesson above), then a crisis or M&A case that requires students to choose a model and justify their window. Use the worked example and the deliverable rubric above as the template.
For students: start with the methodology introduction, follow the application blueprint, then run your event through EDI, CATA, ARC, and AVC in that order. Report the [-1,+1] CAR descriptively and add a robustness (sign or rank) test.
Common pitfalls and misconceptions
- Confounding events. If anything else value-relevant happened in the window, the CAR is not "caused" by your event ("rooster crows, then the sun rises"). Hand-screen the window using the McWilliams-Siegel checklist.
- Misdating. Use the first-news (earliest wire) timestamp, not the press-release dateline; for after-close or weekend news use t+1. Misdating biases CAR toward zero, so a null can be a dating artifact.
- Wrong dictionary. About three-quarters of Harvard-IV "negative" words are not negative in finance (Loughran & McDonald, 2011); use a finance-specific lexicon.
- Over-claiming from N=1. One event cannot support a strong significance claim; report descriptively and use the Corrado/Cowan tests, benchmarked against a peer.
- Confusing pre- and post-event abnormal returns. AR before the date signals leakage or anticipation; AR after the date measures impact. A nonzero pre-event CAR is a finding, not an error.
- Treating tone as a substitute for return. Sentiment explains why; abnormal return and volume measure whether and how much. They are complements.
- Contaminated estimation window. Screen the estimation period too, not just the event window (Aktas, de Bodt & Cousin, 2007); and remember a low market-model R-squared (20% to 40%) is normal, not a defect.
- Quoting a stale magnitude. Benchmarks decay and flip; date-stamp every figure and re-estimate on a recent sub-sample where you can.
Frequently asked questions
How long should my estimation and event windows be?
A common choice is an estimation window of about 120 to 250 trading days ending before the event window, and a short, theory-justified event window such as [-1,+1] or [0,+1] for the clean information-content estimate. Add a longer post-event window only to document drift, and keep long-horizon claims flagged as model-dependent (Brown & Warner, 1985; MacKinlay, 1997).
What is the difference between AR, CAR, and CAAR?
AR (abnormal return) is one firm's actual minus expected return on one day. CAR (cumulative abnormal return) sums one firm's ARs across the event window. CAAR (cumulative average abnormal return) averages CARs across many firms in a sample. A single case study reports a CAR; an aggregated multi-firm study reports a CAAR.
Do I need statistical significance for a single-company case study (N=1)?
You cannot get strong significance from one event. Report the [-1,+1] CAR descriptively, lean on nonparametric tests (Corrado, 1989; Cowan, 1992), and benchmark the firm against a peer or portfolio rather than over-claiming a t-test on one observation.
Which sentiment dictionary should I use?
Use a finance-specific lexicon (the Loughran-McDonald lists), not a general-purpose one such as Harvard-IV, because about three-quarters of Harvard-IV "negative" words ("tax," "cost," "liability") are not negative in finance (Loughran & McDonald, 2011). For teaching, dictionary methods remain the transparent, reproducible choice over opaque LLM scoring.
Should I use the announcement date or the press-release date?
Use the date the information first reached the market (the earliest wire timestamp), not the firm-authored press-release dateline. For news released after the close or on a non-trading day, shift the event date to the next trading day (t+1).
Why run both the abnormal-return and the abnormal-volume calculator?
Price (ARC) tells you the market re-rated the firm; volume (AVC) confirms that information actually arrived and the price move is not noise. A price move without a volume spike is a warning sign; the two together are far more credible than either alone.
What CAR is normal for a recall, breach, or merger?
As rough benchmarks: product recall about -0.5% on average (severe recalls much larger); data breach about -0.3% to -1.1% (severe breaches -3% to -5%); M&A target about +16% over [-1,+1], acquirer near zero (Andrade, Mitchell & Stafford, 2001). If your result is far outside these ranges, check for a confound, a misdated event, or a model error before reporting it.
Related use cases
- Competitive dynamics research: coding firms' action and response sequences from news, the methodological sibling of this page.
- Overview of practical applications: the full hub of event-study use cases.
References
- Acquisti, A., Friedman, A., & Telang, R. (2006). Is there a cost to privacy breaches? An event study. ICIS 2006 Proceedings / Workshop on the Economics of Information Security.
- Aktas, N., de Bodt, E., & Cousin, J. (2007). Event studies with a contaminated estimation period. Journal of Corporate Finance, 13(1), 129-145.
- Alexandridis, G., Antypas, N., & Travlos, N. (2017). Value creation from M&As: New evidence. Journal of Corporate Finance, 45, 632-650.
- Andrade, G., Mitchell, M., & Stafford, E. (2001). New evidence and perspectives on mergers. Journal of Economic Perspectives, 15(2), 103-120.
- Barber, B. M., & Lyon, J. D. (1997). Detecting long-run abnormal stock returns: The empirical power and specification of test statistics. Journal of Financial Economics, 43(3), 341-372.
- Bennett, B., Stulz, R. M., & Wang, Z. (2020). Does joining the S&P 500 index hurt firms? NBER Working Paper / Journal of Financial Economics.
- Bernard, V. L., & Thomas, J. K. (1989). Post-earnings-announcement drift: Delayed price response or risk premium? Journal of Accounting Research, 27(Supplement), 1-36.
- Boehmer, E., Musumeci, J., & Poulsen, A. B. (1991). Event-study methodology under conditions of event-induced variance. Journal of Financial Economics, 30(2), 253-272.
- Brown, S. J., & Warner, J. B. (1985). Using daily stock returns: The case of event studies. Journal of Financial Economics, 14(1), 3-31.
- Campbell, J. Y., Lo, A. W., & MacKinlay, A. C. (1997). The Econometrics of Financial Markets. Princeton University Press.
- Chakravarthy, B., & White, R. (2001). Strategy process: Forming, implementing and changing strategies. In Handbook of Strategy and Management. Sage.
- Chen, M.-J., Smith, K. G., & Grimm, C. M. (1992). Action characteristics as predictors of competitive responses. Management Science, 38(3), 439-455.
- Chordia, T., Subrahmanyam, A., & Tong, Q. (2014). Have capital market anomalies attenuated in the recent era of high liquidity and trading activity? Journal of Accounting and Economics, 58(1), 41-58.
- Corrado, C. J. (1989). A nonparametric test for abnormal security-price performance in event studies. Journal of Financial Economics, 23(2), 385-395.
- Cowan, A. R. (1992). Nonparametric event study tests. Review of Quantitative Finance and Accounting, 2(4), 343-358.
- Eckbo, B. E. (1983). Horizontal mergers, collusion, and stockholder wealth. Journal of Financial Economics, 11(1-4), 241-273.
- Eisenhardt, K. M. (1989). Building theories from case study research. Academy of Management Review, 14(4), 532-550.
- Fama, E. F. (1998). Market efficiency, long-term returns, and behavioral finance. Journal of Financial Economics, 49(3), 283-306.
- Fama, E. F., Fisher, L., Jensen, M. C., & Roll, R. (1969). The adjustment of stock prices to new information. International Economic Review, 10(1), 1-21.
- Ferrier, W. J. (2001). Navigating the competitive landscape: The drivers and consequences of competitive aggressiveness. Academy of Management Journal, 44(4), 858-877.
- Goldman Sachs Group, Inc. v. Arkansas Teacher Retirement System, 594 U.S. 113 (2021).
- Greenwood, R., & Sammon, M. (2023). The disappearing index effect. Harvard Business School Working Paper 23-025.
- Halliburton Co. v. Erica P. John Fund, Inc., 573 U.S. 258 (2014).
- Jacobs, B. W., & Singhal, V. R. (2020). Shareholder value effects of the Volkswagen emissions scandal on the automotive ecosystem. Production and Operations Management, 29(10), 2230-2251.
- Jauch, L. R., Osborn, R. N., & Martin, T. N. (1980). Structured content analysis of cases: A complementary method for organizational research. Academy of Management Review, 5(4), 517-525.
- Kolari, J. W., & Pynnonen, S. (2010). Event study testing with cross-sectional correlation of abnormal returns. Review of Financial Studies, 23(11), 3996-4025.
- Lopez-Lira, A., & Tang, Y. (2023). Can ChatGPT forecast stock price movements? Return predictability and large language models. SSRN Working Paper 4412788 / arXiv 2304.07619.
- Loughran, T., & McDonald, B. (2011). When is a liability not a liability? Textual analysis, dictionaries, and 10-Ks. Journal of Finance, 66(1), 35-65.
- Loughran, T., & McDonald, B. (2016). Textual analysis in accounting and finance: A survey. Journal of Accounting Research, 54(4), 1187-1230.
- Lyon, J. D., Barber, B. M., & Tsai, C.-L. (1999). Improved methods for tests of long-run abnormal stock returns. Journal of Finance, 54(1), 165-201.
- MacKinlay, A. C. (1997). Event studies in economics and finance. Journal of Economic Literature, 35(1), 13-39.
- Martineau, C. (2022). Rest in peace post-earnings announcement drift. Critical Finance Review, 11(3-4), 613-646.
- McKenny, A. F., Aguinis, H., Short, J. C., & Anglin, A. H. (2018). What doesn't get measured does exist: Improving the accuracy of computer-aided text analysis. Journal of Management, 44(7), 2909-2933.
- McLean, R. D., & Pontiff, J. (2016). Does academic research destroy stock return predictability? Journal of Finance, 71(1), 5-32.
- McWilliams, A., & Siegel, D. (1997). Event studies in management research: Theoretical and empirical issues. Academy of Management Journal, 40(3), 626-657.
- Meursault, V., Liang, P. J., Routledge, B. R., & Scanlon, M. M. (2023). PEAD.txt: Post-earnings-announcement drift using text. Journal of Financial and Quantitative Analysis (forthcoming).
- Patel, N., & Welch, I. (2017). Extended stock returns in response to S&P 500 index changes. Review of Asset Pricing Studies, 7(2), 172-208.
- Short, J. C., Broberg, J. C., Cogliser, C. C., & Brigham, K. H. (2010). Construct validation using computer-aided text analysis (CATA). Organizational Research Methods, 13(2), 320-347.
- Sorescu, A., Warren, N. L., & Ertekin, L. (2017). Event study methodology in the marketing literature: An overview. Journal of the Academy of Marketing Science, 45(2), 186-207.
- Stillman, R. (1983). Examining antitrust policy towards horizontal mergers. Journal of Financial Economics, 11(1-4), 225-240.
- Tetlock, P. C. (2007). Giving content to investor sentiment: The role of media in the stock market. Journal of Finance, 62(3), 1139-1168.
- Tetlock, P. C., Saar-Tsechansky, M., & Macskassy, S. (2008). More than words: Quantifying language to measure firms' fundamentals. Journal of Finance, 63(3), 1437-1467.
- Van de Ven, A. H., Polley, D. E., Garud, R., & Venkataraman, S. (1999). The Innovation Journey. Oxford University Press.
- Van de Ven, A. H., & Poole, M. S. (1995). Explaining development and change in organizations. Academy of Management Review, 20(3), 510-540.
For the full list of methodological sources, see our references page.